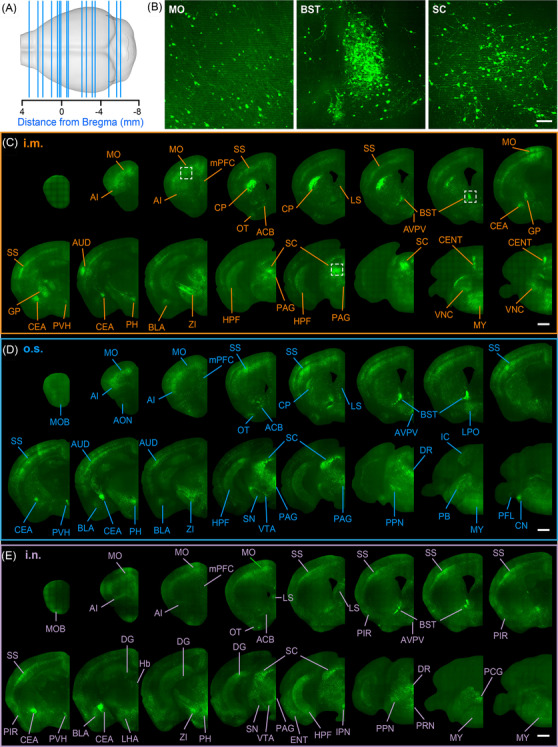
FIGURE 2.

Anatomical classification of RABV distribution by different infection routes. (A) The anatomical localization of the selected coronal sections shown in (C–E). Scale bar, 1 mm. (B) Enlarged views of the motor cortex (MO), bed nuclei of the stria terminalis (BNST) and the superior colliculus (SC) indicated by the white box from panel C. A single RABV‐infected cell is shown. Scale bar, 100 μm. (C–E) The distribution of RABV by infection route, i.m., o.s. and i.n., respectively
