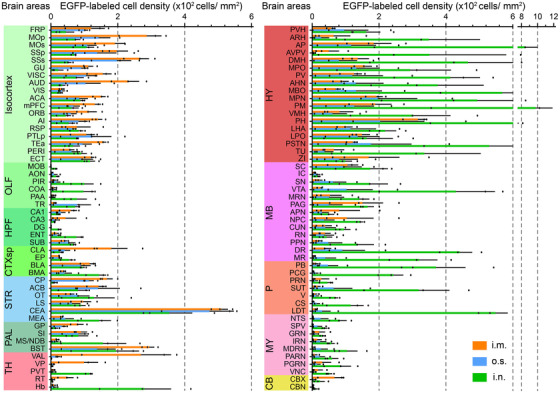
FIGURE 3.

Comparison of RABV distribution in nuclei by different infection routes. Cell density of EGFP‐labelled infected cells for each anatomical subregion, respectively. Data represent the mean ± standard deviation (n = 3), and the abbreviations of anatomical subregions are listed in Table S1.
