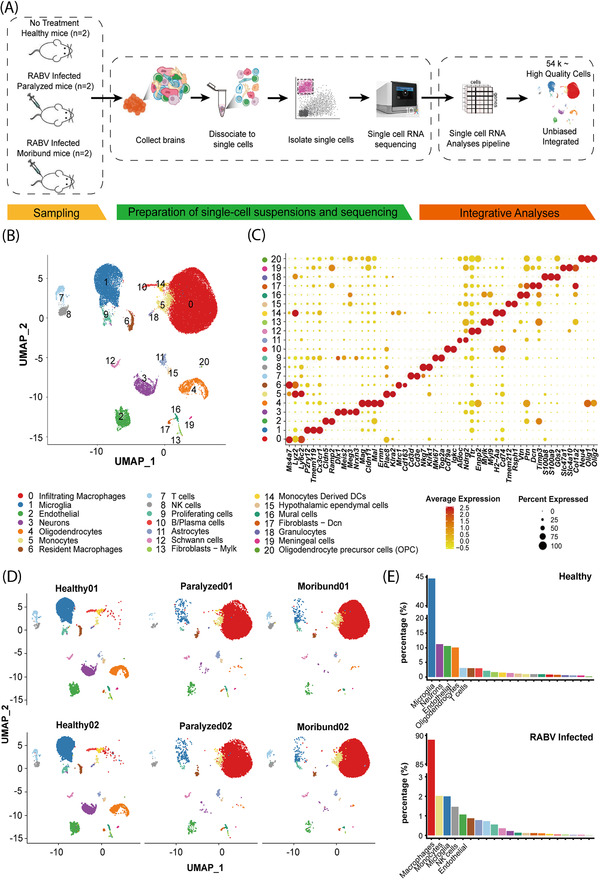
FIGURE 4.

Single‐cell transcriptional profiling of RABV infection in the brain. (A) A scheme showing the overall experimental design. scRNA‐seq was applied to brain cells across the three conditions (healthy, paralyzed and moribund), and the output data were integrated and used for expression analyses. (B) Cellular populations identified. The UMAP projection of 54 452 single cells from healthy (n = 2), paralyzed (n = 2) and moribund (n = 2) mouse brains, showing the formation of 21 clusters with the respective number and name labels. Each dot corresponds to a single cell, coloured according to cell types. (C) Dotplot shows the expression level of canonical cell markers that are used to identify clusters as represented in the UMAP plot. The colour of dots represents expression levels and the size denotes expression percentage. (D) UMAP projection of each sample. Each dot corresponds to a single cell and is coloured according to cell type. (E) Barplot shows the cell composition of healthy and the mean of the paralyzed and moribund conditions. Cellular populations were sorted in descending order and top five were labelled with cluster names
