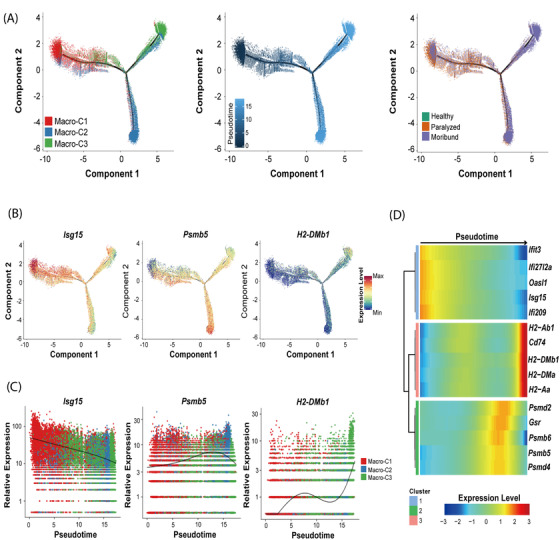
FIGURE 6.

The potential developmental trajectory of three infiltrating macrophage subsets after RABV infection. (A) The potential developmental trajectory of three infiltrating macrophage subsets inferred by Monocle. Each dot corresponds to a single cell, coloured according to subsets (left), pseudotime (middle) and conditions (right). (B) The expression levels of three exampled marker genes in the developmental trajectory. (C) Spline plots showing the expression kinetic trends of three exampled marker genes along the pseudotime. (D) Heatmap shows three modules of genes that co‐vary across pseudotimes
