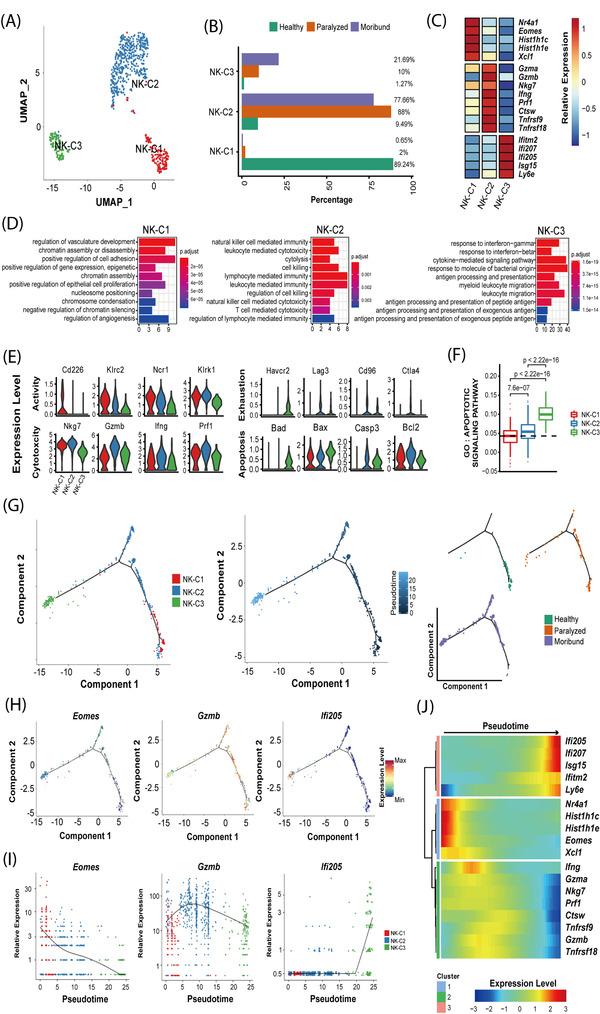
FIGURE 7.

Transcriptomic features and potential developmental trajectory of NK cell subsets. (A) UMAP projection of 719 NK cells. Each dot corresponds to a single cell, coloured according to subsets. (B) Barplot shows the condition preference of three NK subsets, coloured according to three conditions. (C) Heatmap shows the relative expression levels of selected markers for three NK subsets. (D) Gene enrichment analyses of differentially expressed genes (DEGs) for three clusters. Gene Ontology (GO) terms are labelled with names and sorted by the adjusted p‐value. Enriched gene count as bar height and is coloured according to the adjusted p‐value. The top 10 enriched GO terms are shown. (E) Violin plots showing the expression distribution of exampled markers in three NK subsets. (F) Box plots of the expression levels of GO apoptosis terms across different conditions. Conditions are shown in different colours. Horizontal lines represent median values, with whiskers extending to the farthest data point within a maximum of 1.5 × interquartile range. P‐values were labelled and calculated by two‐sided Wilcoxon rank sum test. (G) The potential developmental trajectory of three NK subsets. Each dot corresponds to a single cell, coloured according to subsets (left), pseudotime (middle) and conditions (right). (H) The expression levels of three exampled marker genes in the developmental trajectory. (I) Spline plots showing the expression kinetic trends of three exampled marker genes along the pseudotime. (J) Heatmap shows three modules of genes that co‐vary across pseudotime
