Figure 3.
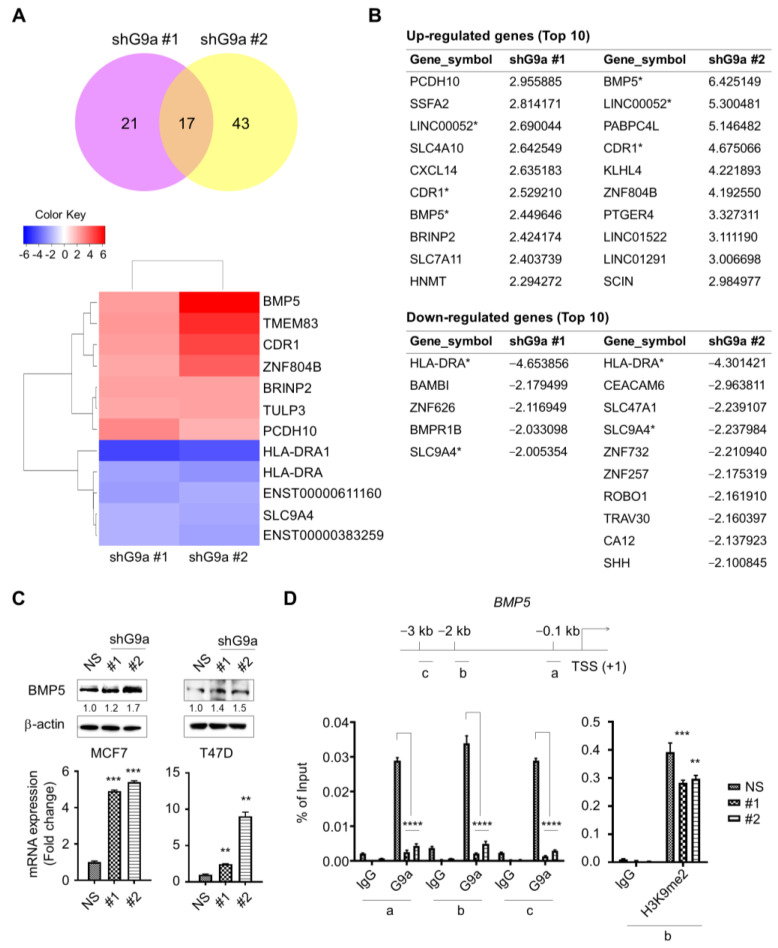
G9a knockdown may lead to increase in BMP5 expression. (A) Regulatory factors suppressing tumor aggressiveness were identified by using microarray analysis. (B) Expression levels for each gene were compared (ratios between gene expression levels of non-silencing control). In two G9a knockdown cells (shG9a #1 and shG9a #2), expression levels for each gene were compared to those of non-silencing control. Then the most upregulated and downregulated genes were screened. (C) G9a knockdown cells showed increase in BMP5 expression. (D) Reduced G9a occupancy was found at the BMP5 promoter region. G9a knockdown cells also showed decreased H3K9me2 occupancy at the promoter region of BMP5. p values were calculated using ANOVA. * p < 0.05, ** p < 0.01, *** p < 0.001, **** p < 0.0001.

