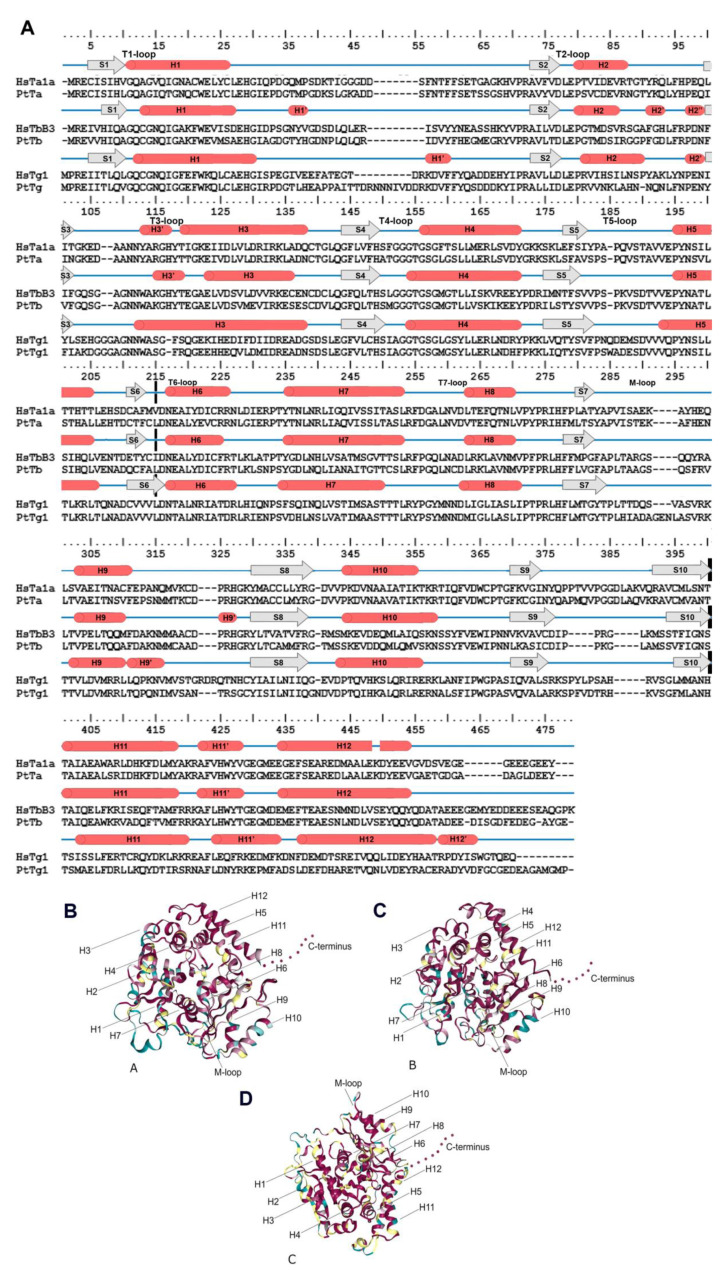
Figure 1.
Tubulin structure. (A): Secondary structure for α- and b-tubulin for example H. sapiens (HsTa1A—α-tubulins, HsTb3—β-tubulins and HsTg1—γ-tubulin) and P. tricornutum (PtTa—α-tubulins, PtTb—β-tubulins and PtTg1—γ-tubulin). β-chains are marked S1–S10 and 12 α-helices—H1–H12. Cross black lines delimit major domains. (B–D): Structural conservation mapping performing on the ConSurf 2016 webserver; this conservation was assayed for all diatom tubulins. (B): α-tubulins; (C): β-tubulins; (D): γ-tubulins. Conserved amino acid residues are shown in shades of red, and the variable amino acids are showed in shades of blue. Residues with insufficient data are showed in shades of yellow.

