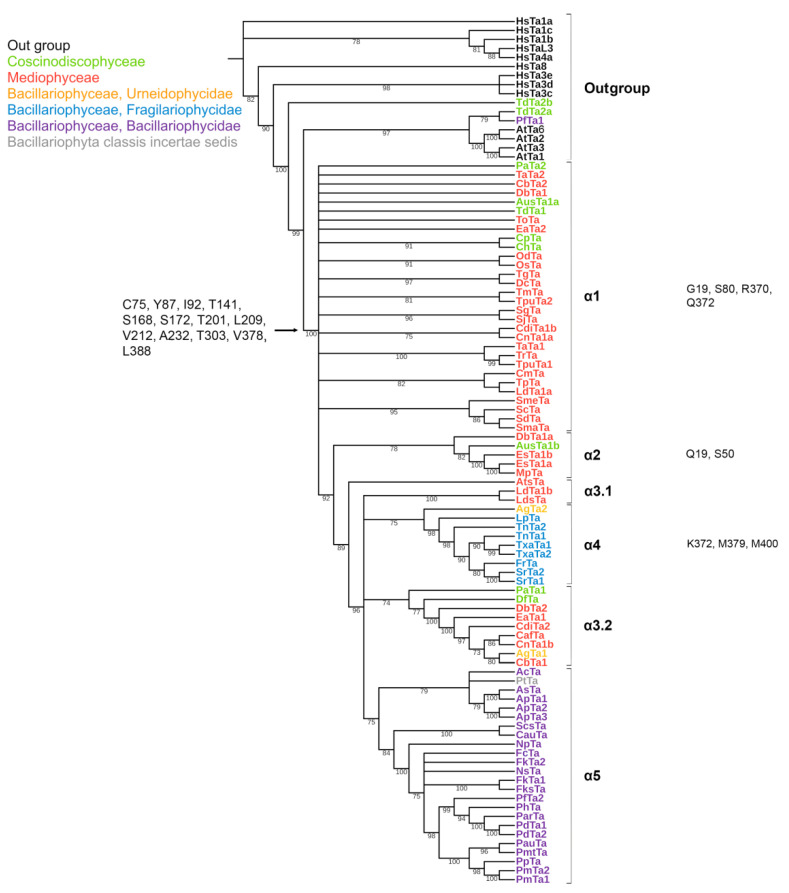
Figure 2.
Phylogenetic tree of diatom α-tubulins. A total of 101 sequences were used to build a Maximum Likelihood tree using the LG + F + R7 substitution model. The amino acids conserved in diatoms are on the left , characteristic amino acids of certain α-tubulin groups are on the right. Large taxa are highlighted in color: green, Coscinodiscophyceae; red, Mediophyceae; blue, Bacillariophyceae, Fragilariophycidae; orange, Bacillariophyceae, Urneidophycidae; purple, Bacillariophyceae, Bacillariophycidae.

