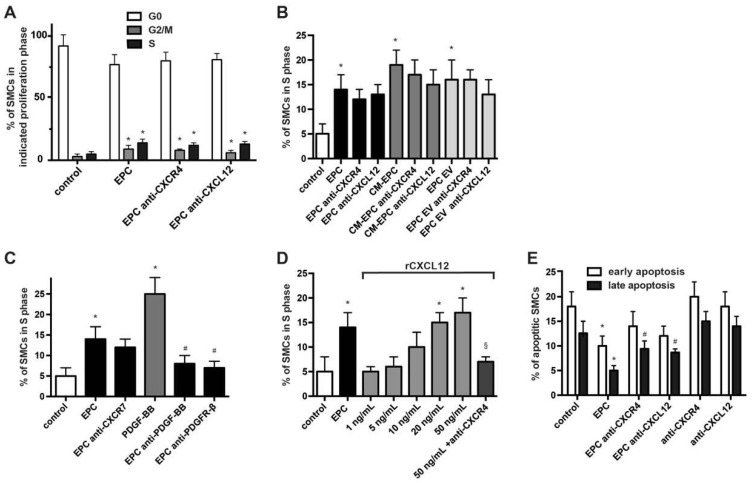
Figure 2.
Higher concentration of CXCL12 induce proliferation of SMCs via CXCR4. (A) Flow cytometry-based cell cycle analysis of SMCs treated for 24 h with EPCs in the presence or absence of anti-CXCR4 and anti-CXCL12 Abs as indicated. * p < 0.05 vs. untreated SMCs (control); n = 5. (B–D) Analysis of SMCs in S phase as determined 24 h after treatment as indicated. * p < 0.05 vs. untreated SMCs (control), # p < 0.05 vs. EPC treated SMCs in the absence of blocking Abs, § p < 0.05 vs. rCXCL12 50 ng/mL treated SMCs; n = 4 to 6. (E) Annexin V-FITC/PI staining with subsequent flow cytometry analysis to determine the rate of apoptotic SMCs treated as indicated. * p < 0.05 vs. untreated SMCs (control) for respective early and late apoptosis, # p < 0.05 vs. EPC-treated SMCs for late apoptosis; n = 5.

