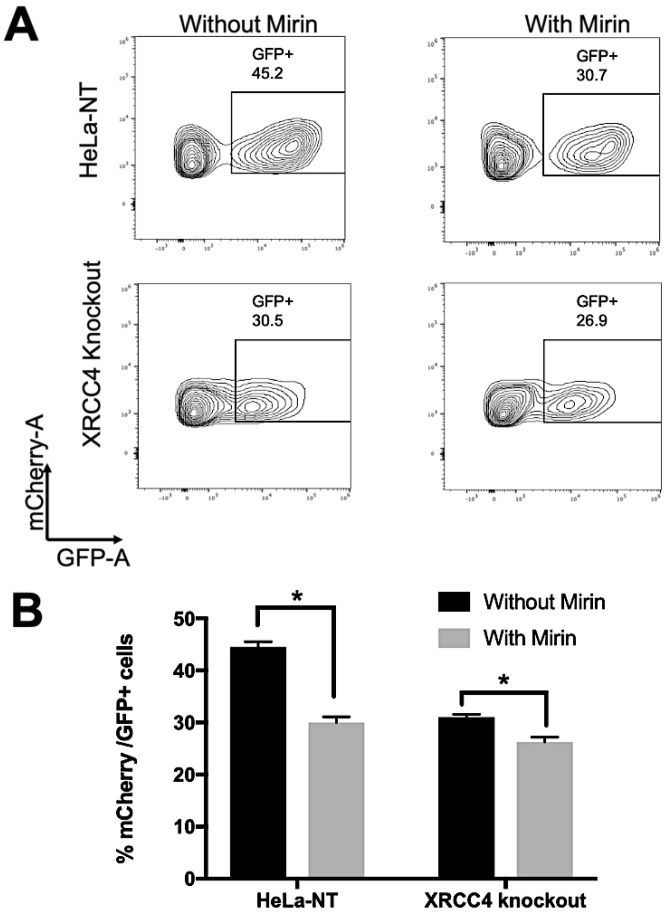
Figure 3.
Measurement of repair efficiency using flow cytometry. (A) Representative images of cells positive for mCherry expression then gated for GFP+ expression. (B) Mean GFP+ as a percentage of mCherry+ cells were plotted with standard deviations. Experiments were performed in triplicate and data were analyzed using FLowJo 10.7.1. Statistical significance was determined by ANOVA where * indicates p < 0.01. All the experiments were performed independently three times and the data represent the mean ± standard deviation.

