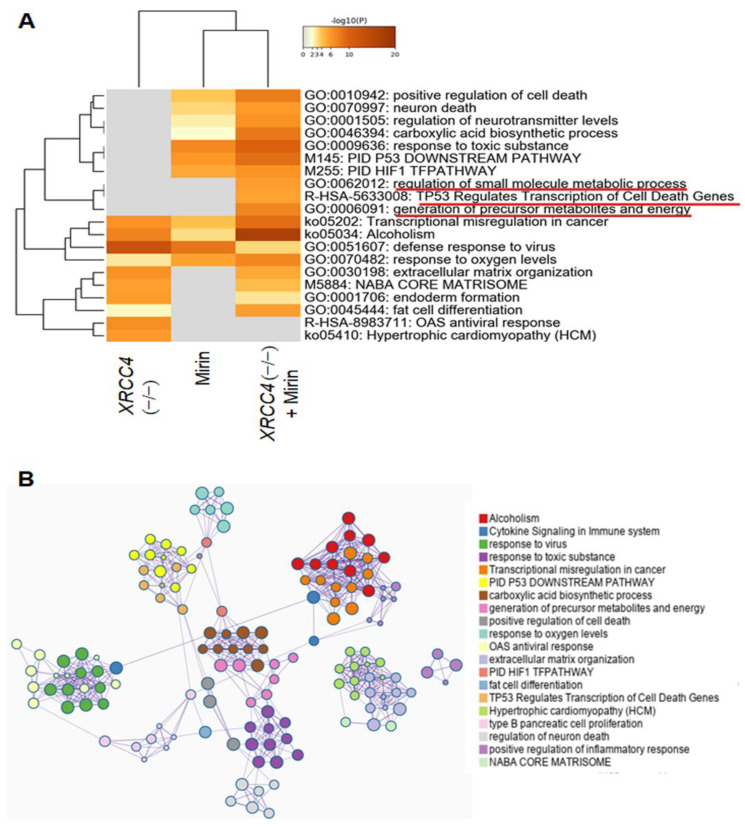
Figure 6.
Functional enrichment analysis. (A) A heatmap with embedded dendrogram showing relationships between enriched GO/KEGG terms and canonical pathways. 0.3 kappa score was applied as the threshold to cast the tree into term clusters. Differential expression is calculated from samples compared to control HeLa-NT cells. Key pathways with large changes in gene expression for the XRCC4 knockout +mirin sample are underlined with red lines. (B) A network graph with enrichment ontology clusters colored by cluster ID. Each term is represented by a node, where its size is proportional to the number of genes for each term. Terms with a similarity score >0.3 are linked by an edge (the thickness of the edge represents the similarity score). The network was created with Cytoscape (v3.1.2). The analyses are based on duplicate experiments.

