Figure 6.
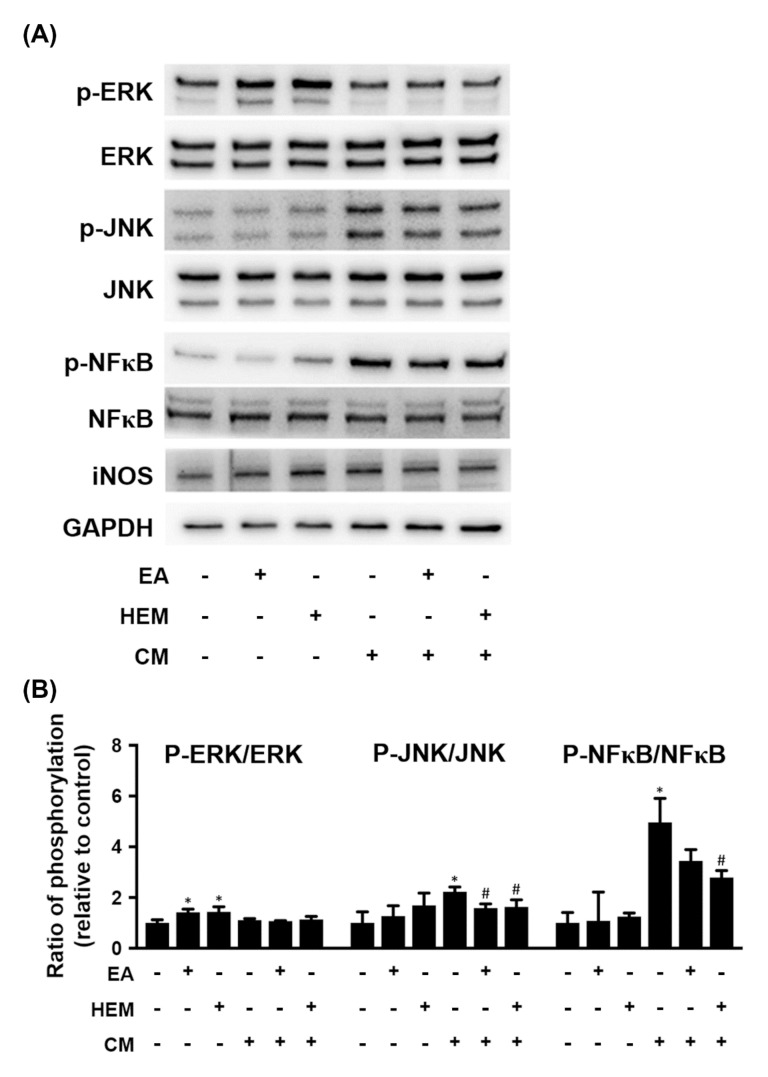
Effect of EA or HEM on signaling molecules from microglia-mediated neurotoxicity. The culture conditions of the N2a cells are shown in Figure 7. (A) The protein levels of ERK 1/2, JNK, NF-κB and iNOS were detected in N2a cells by western blot (n = 3). GAPDH was used as a loading control. (B) Quantitative densitometry was used to calculate the phosphorylation ratios of p-ERK to ERK, p-JNK to JNK and p-NF-κB to NF-κB, which were normalized to the control. The relative density was estimated by NIH ImageJ densitometric analysis. The results are expressed as the mean ± SD. * p < 0.05 compared to the control group. # p < 0.05 compared to the BV-2 conditioned medium treatment group.

