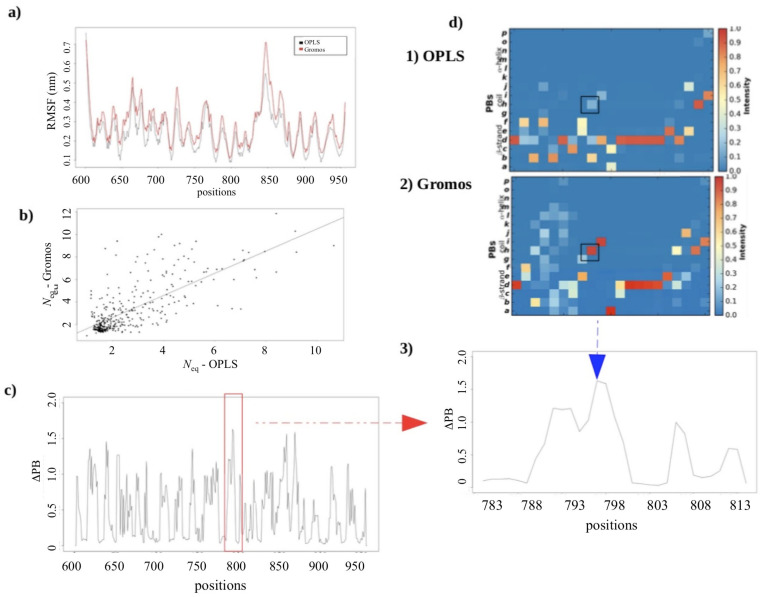
Figure 5.
OPLS ff vs. Gromos ff. (a) RMSF and (b) Correlation between the Neq values of each residue in Calf-1 simulated with OPLS ff (x-axis) to Calf-1 simulated in Gromos ff (y-axis). (c) ΔPB between the simulations performed in these two forcefields. (d) PBs occurrence map [29] of positions 783 to 813 for (1) OPLS ff, and (2) Gromos ff, with corresponding (3) focused ΔPB profile.

