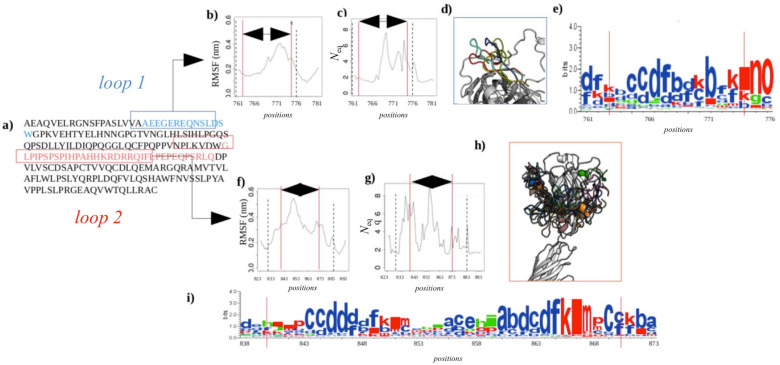
Figure 6.
Calf-2 completed loops. (a) Sequence of the Calf-2 domain: in blue: the first completed loop; in red: the second one. (b,f) show the RMSF values for two loops. (c,g) show the Neq values for the two loops. (d,h) are the 3-D representation of different conformations of the two modeled loops. (e,i) show the conservation logo maps of these two loops. The red lines on the graphs indicate the boundaries of the completed loops and in black dot lines the limits of entire loops.

