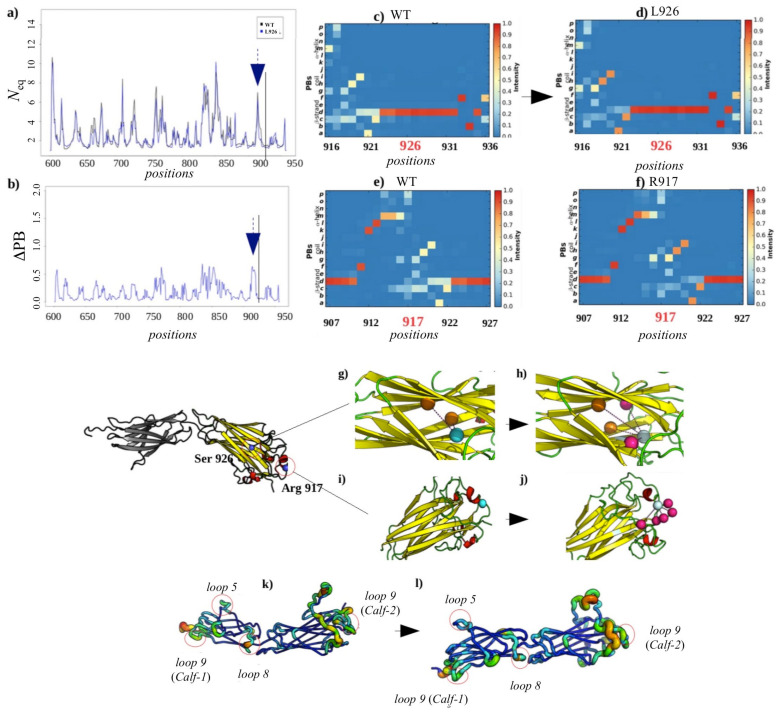
Figure 9.
S926L GT variant. (a) Neq of the wild system (S926, color in black) and GT variant (L926, color in blue). (b) ΔPB between the two systems. The mutated residue is indicated by a black line, and the residue with the strongest ΔPB by arrows. PB occurrence maps are shown around position 926 and 917 (c) and (f) for the wild-type and (d) and (e) for the variant. (g) Interactions of residue S926 (cyan) and (h) of residue L926 (light cyan); in orange, the residues interact in the same way in the wild-type and the variant; in violet, the new interacting residue. (i) Same representation for the residue R917 in the wild-type and (j) for the variant. Representation of the Calf-1 and Calf-2 domain according to the flexibility measured by values of Neq for (k) wild-type and (l) for the variant, moving from the least flexible (thin line, blue) to the most mobile (thick line, red). The most mobile parts representing high values of Neq are circled in red.

