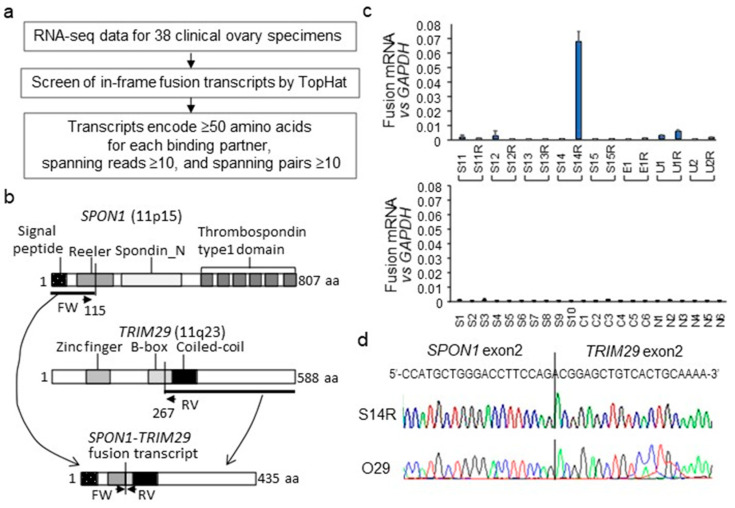
Figure 1.
Identification of SPON1-TRIM29 fusion transcript in ovarian cancer by RNA-seq. (a) Schematical presentation of strategies to identify fusion transcripts in ovarian cancers by RNA-seq. (b) Schematic presentation of the putative SPON1-TRIM29 fusion protein translated from the SPON1-TRIM29 fusion transcript in which the SPON1 exon2 is fused in-frame to the TRIM29 exon2. SPON1 and TRIM29 proteins are represented with their domain structures. Primers for specific amplification of SPON1-TRIM29 fusion mRNA in RT-qPCR are indicated as arrows (FW and RV). (c) Expression levels of SPON1-TRIM29 fusion transcript in 38 clinical ovary specimens analyzed by RT-qPCR. cDNA samples prepared from clinical specimens were amplified using primer sets that span the fusion point. Upper panel for 8 matched pairs of primary and recurrent ovarian cancer specimens. Lower panel for 10 high-grade serous carcinomas (HGSC, #S1–S10), 6 clear cell carcinomas (CCC, #C1–#C6), and 6 normal ovary tissues (#N1-N6). The mRNA levels of SPON1-TRIM29 fusion transcript are normalized with GAPDH and the data are presented as means ± SD (n = 3). (d) Chromatograms for Sanger sequencing results for SPON1-TRIM29 fusion transcript in tumors #S14R and #O29.

