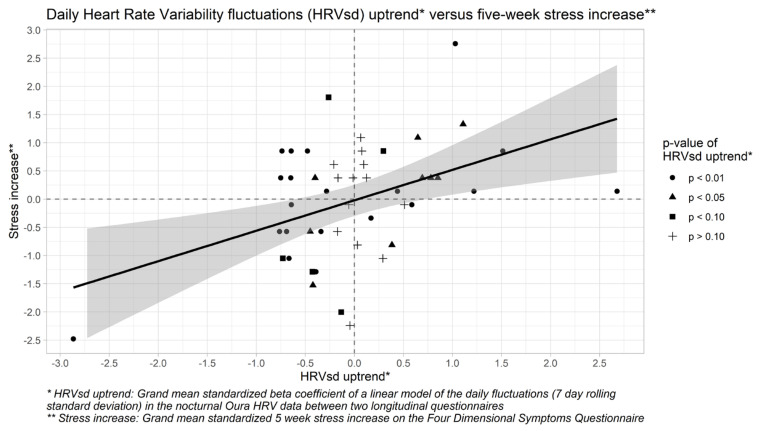
Figure 1.
Scatter plot for the five-week uptrends in the 7-day rolling standard deviation of the Heart Rate Variability (HRVsd) versus five-week stress increases on the Four-Dimensional Symptom Questionnaire (4DSQ) in all 47 observations of the 9 participants in this study. The grey area represents the 95% confidence interval for the values that are estimated by the linear model (the thick black line).

