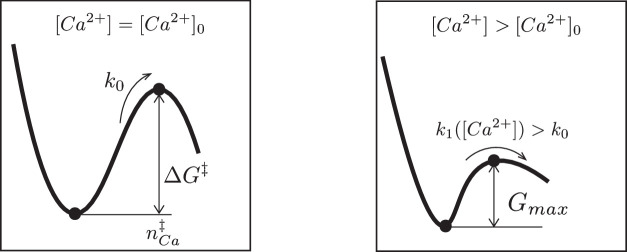
Appendix 1—figure 1. Schematic representation of the free energy profile of a SNARE assembly.
(Left) The free energy profile at a reference calcium level . The activation barrier and the average number of calcium ions bound to the SNARE assembly at transition state are indicated. (Right) An elevation of the calcium level lowers the free energy barrier and thereby increases the rate k1 of the SNARE conformation transition.

