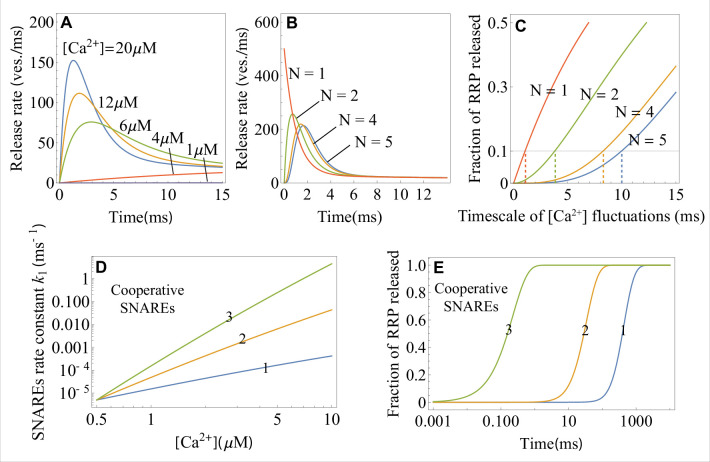
Appendix 1—figure 2. The effects of calcium concentration, the critical number of independent SNARE assemblies, and the number of cooperative SNAREs within a super-assembly on the neurotransmitter release dynamics, as predicted by the theory.
(A) Temporal profiles of the average release rate from Equations 1 and 4 across the range of calcium concentrations (indicated) typical for an action potential. Due to the exponential factor in Equation 4, the release turns on rapidly upon calcium influx and terminates rapidly with calcium depletion, resulting in a high temporal precision of synaptic release. (B) Temporal profile of the average release rate (Equation 1) when independent SNARE assemblies per vesicle are required for fusion. provides the optimal balance between stability with respect to fluctuations in calcium concentration (low release rate on the sub-millisecond timescale) and temporal precision (the fastest rise of average release rate). (C) Fraction of the RRP vesicles released due to spontaneous calcium fluctuations of varying timescales when SNARE assemblies per vesicle are required for fusion. Synapses with the larger exhibit robustness (low release fraction) against slower fluctuations. The timescales of fluctuations for which the synapse with a given is robust (fraction of released RRP , horizontal line) are indicated. (D) Transition rate for a single-SNARE assembly and for a super-assembly of 2 or 3 SNAREs as a function of calcium concentration, from Equation 4. Cooperativity between SNAREs within a super-assembly results in a steeper increase of the rate of conformational change with and hence in a faster vesicle release. Every additional SNARE within the super-assembly increases the release rate by a factor of at . (E) Temporal profiles of the fraction of RRP vesicles released for a (super)-assembly of or 3 SNAREs, from Equation 2, at . The effect of cooperativity between two or three SNAREs is incorporated through the parameter values for the transition barrier, and , which are, respectively, 2 and 3 times the values for a single SNARE. The parameter values for the 1 SNARE curve are matched to the in vitro experiment on syt1 (Hui et al., 2005). Parameter values are given in Appendix 3.

