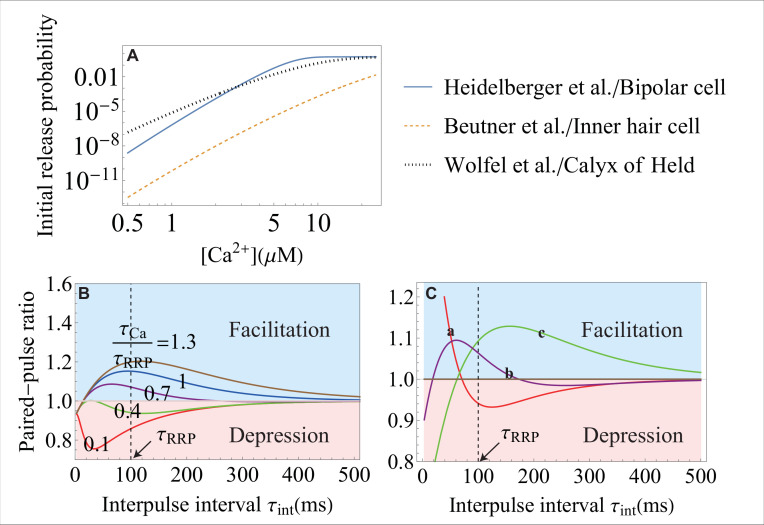
Appendix 1—figure 3. The effect of the molecular-level properties of synapses on release probability and short-term plasticity.
(A) The initial vesicle release probability, , over a range of typical in experiments, for different synapses. The release probability can vary significantly in different synapses because of different types of - sensors, different coupling between regulatory proteins and SNAREs, and different amount of the initial entry. The parameters for each curve correspond to the data from the studies that are indicated on the right. (B) Weaker -sensitivity (here, it is of that in Figure 4G) of a SNARE assembly results in a smaller dynamic range of short-term facilitation. The -sensitivity of a SNARE is defined as the ratio of the conformational rate constants (Equation 4) during the action potential, , and at rest, . The value of is set at . (C) Distinct short-term facilitation/depression modes in synapses that differ on the molecular level, from theory (Equation 8). Three different sets of parameters , , and are used for curves a, b and c, representing different properties of the molecular constituents for the three synapses. In curve a, the high frequency transient input (with small ) is facilitated and the low frequency input (with large ) is depressed. The effects are reversed in curve c with depression at high frequency and facilitation at low frequency. In curve b, inputs with intermediate frequencies are facilitated and inputs with high and low frequencies are depressed. The dynamic range for each curve can be amplified by changing the timescale for RRP replenishment, . Parameter values are given in Appendix 3.

