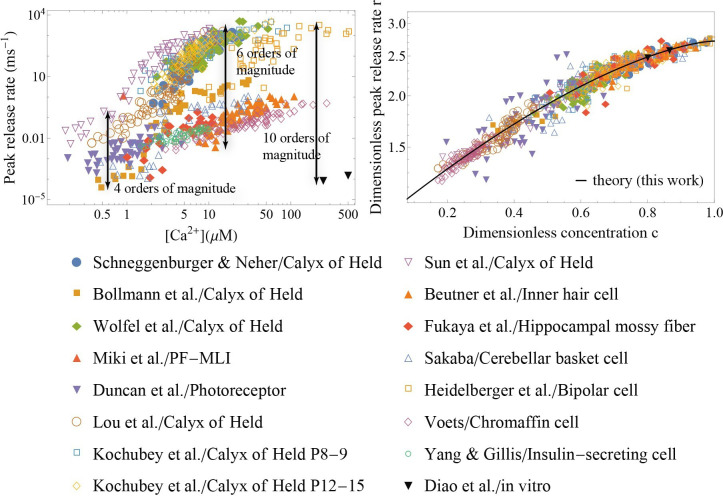
Figure 2. Application of the theory to experiments: verifying universality and quantifying specificity.
(Left) Measured peak release rate versus calcium concentration for a variety of synapses (Schneggenburger and Neher, 2000; Bollmann et al., 2000; Miki et al., 2018; Duncan et al., 2010; Diao et al., 2012; Kochubey et al., 2009; Wölfel et al., 2007; Lou et al., 2005; Heidelberger et al., 1994; Beutner et al., 2001; Fukaya et al., 2021; Sakaba, 2008; Voets, 2000; Yang and Gillis, 2004; Sun et al., 2007). (Right) The same data as shown on the left, after the peak release rate and calcium concentration have been rescaled. Despite ten orders of magnitude variation in the dynamic range and more than 3 orders of magnitude variation in calcium concentration (left), the data collapse onto a single master curve, Equation 5 (right). The collapse indicates that the established scaling in Equation 5 is universal across different synapses. The distinct sets of parameters for each of the synapses (Appendix 3—table 2) demonstrate the predictive power of the theory as a tool for extracting the unique properties of individual synapses from experimental data.

