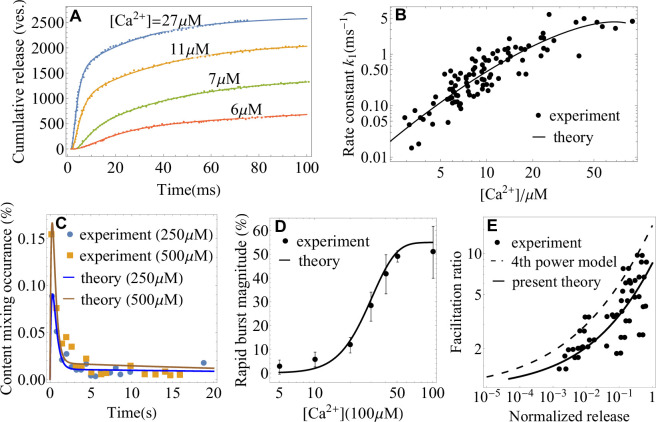
Figure 3. Application of the theory to experiments: extracting parameters of synaptic fusion machinery.
(A) Cumulative release from in vivo experiments (Wölfel et al., 2007) on the Calyx of Held (symbols) and a fit with Equation 2 (lines) for different calcium concentrations. (B) -dependent rate constant of SNARE conformational transition from in vivo experiments (Wölfel et al., 2007) and a fit with Equation 4. (C) Content mixing occurrence from in vitro experiments (Diao et al., 2012) and a fit with Equation 1. (D) Rapid burst magnitude from in vitro experiments (Kyoung et al., 2011) and Equation 2. (E) Facilitation as a function of the ratio of residual and control release (as defined in Appendix 3) from the experiment (Barrett and Stevens, 1972) on the frog neuromuscular junction (symbols) and from the present theory, Equation 4 (solid line). The fourth-power model (Barrett and Stevens, 1972; Jackman and Regehr, 2017) is also shown for comparison (dashed line). Parameters are shown in Appendix 3.

