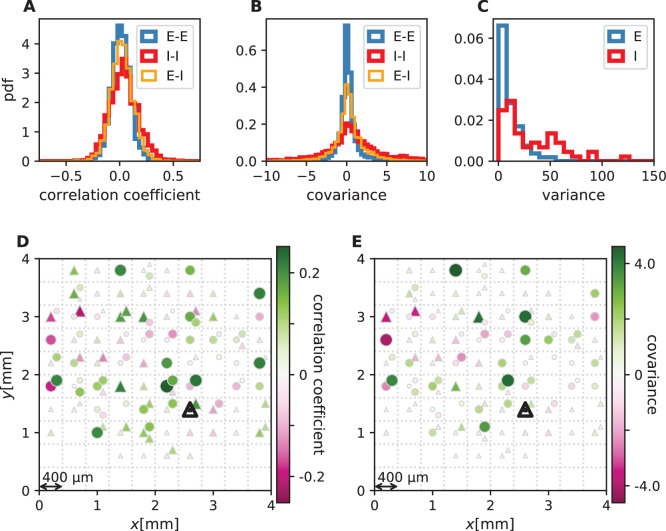
Appendix 1—figure 1. Correlations and covariances.
The shown data is taken from session E2. (E-E: excitatory-excitatory, E-I: excitatory-inhibitory, I-I: inhibitory-inhibitory). (A) Population-resolved distribution of pairwise spike-count Pearson correlation coefficients. Same data as in Figure 1C. (B) Population-resolved distribution of pairwise spike-count covariances. (C) Population-resolved distribution of variances. (D) Pairwise spike-count correlation coefficients with respect to the neuron marked by black triangle. Grid indicates electrodes of a Utah array, triangles and circles correspond to putative excitatory and inhibitory neurons, respectively. Size as well as color of markers represent correlation. Neurons within the same square were recorded on the same electrode. Same data as in Figure 1D. (E) Pairwise spike-count covariances with respect to the neuron marked by black triangle.

