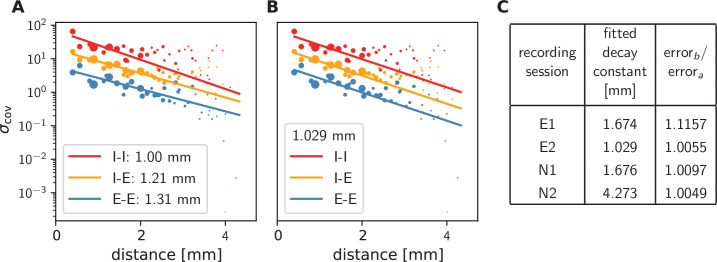
Figure 4. Long-range covariances in macaque motor cortex.
Variance of covariances as a function of distance. (A) Population-specific exponential fits (lines) to variances of covariances (dots) in session E2, with fitted decay constants indicated in the legend (I-I: putative inhibitory neuron pairs, I-E: inhibitory-excitatory, E-E: excitatory pairs). Dots show the empirical estimate of the variance of the covariance distribution for each distance. Size of the dots represents relative count of pairs per distance and was used as weighting factor for the fits to compensate for uncertainty at large distances, where variance estimates are based on fewer samples. Mean squared error 2.918. (B) Population-specific exponential fits (lines) analogous to (A), with slopes constrained to be identical. This procedure yields a single fitted decay constant of 1.029 mm. Mean squared error 2.934. (C) Table listing decay constants fitted as in (B) for all recording sessions and the ratios between mean squared errors of the fits obtained in procedures B and A.

