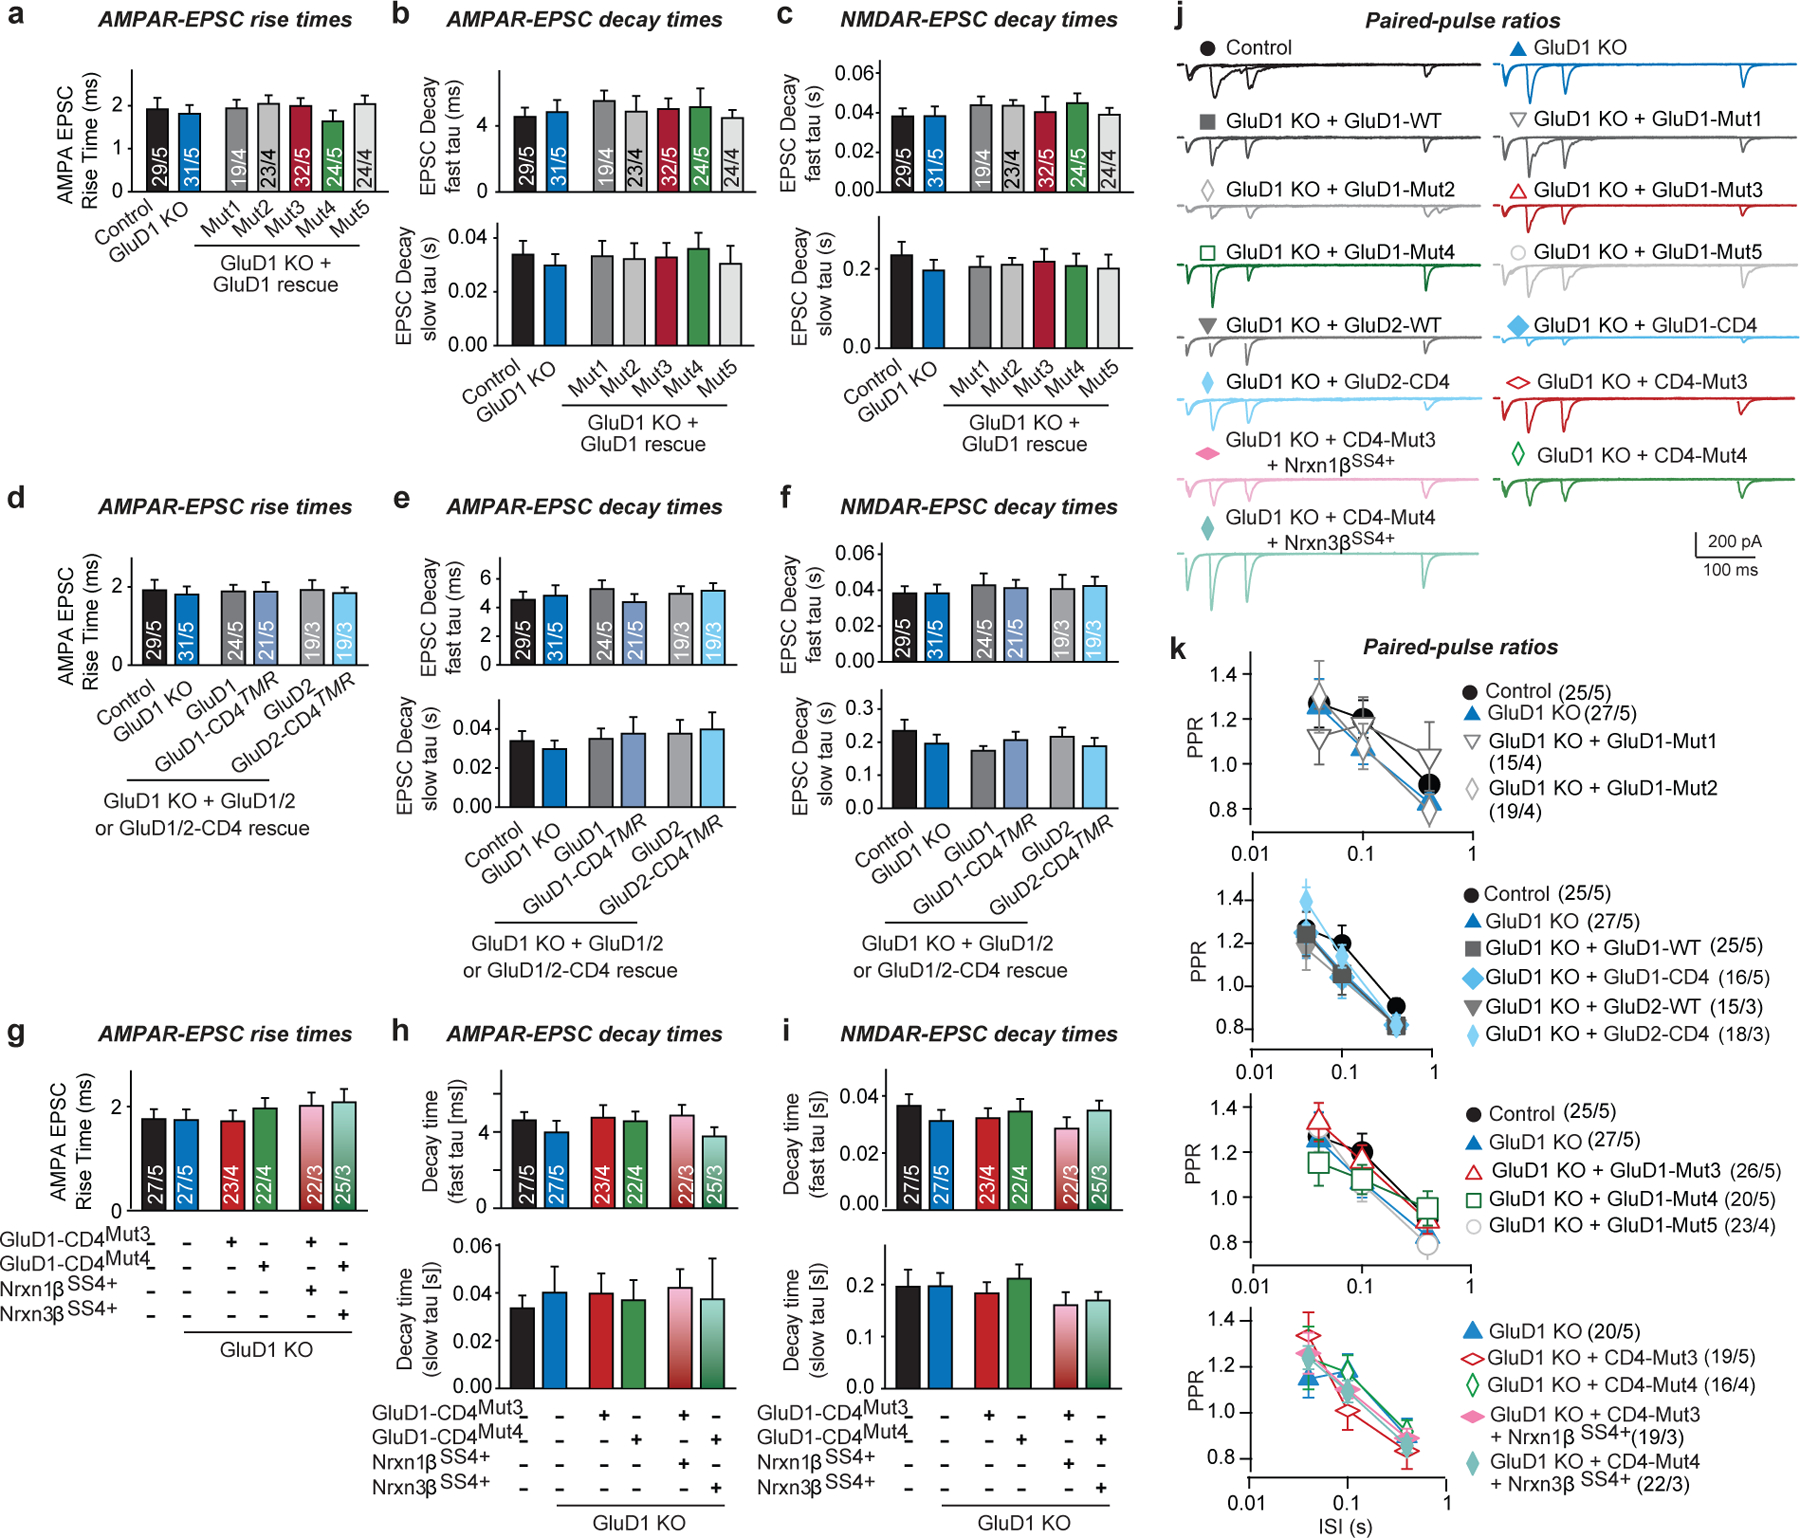
Extended Data Fig. 7. Analysis of EPSC kinetics and PPRs in various rescue experiments with cultured GluD1-deficient neurons.

a–i, Quantification of EPSC kinetics for measurements of evoked EPSCs under various GluD1 KO and rescue conditions as indicated, demonstrating that the EPSC kinetics do not change with any experimental manipulation (EPSC rise time (20–80%) (a, d, g); AMPAR-EPSC decay constants recorded at −70 mV and fitted with a double-exponential function (top, fast component; bottom, slow component (b, e, h); NMDAR-EPSC decay constants recorded at +40 mV and fitted with a double-exponential function (top, fast component; bottom, slow component (c, f, i)). Data are from the experiments described in Figs. 4c–e, n–p, 5c–e. j, Representative traces of PPR recordings in cultured neurons under the indicated conditions. k, Summary graphs of the PPRs as a function of the inter-stimulus intervals under the indicated conditions. Data are means ± s.e.m. (for a–i, n values are shown in Figs. 4c–e, n–p, 5c–e; for j, k, neurons/independent experiments are shown in k). Statistical significance was assessed by two-tailed Student’s t-test or two-way ANOVA. No statistically significant differences were observed. Please see source data for details.
