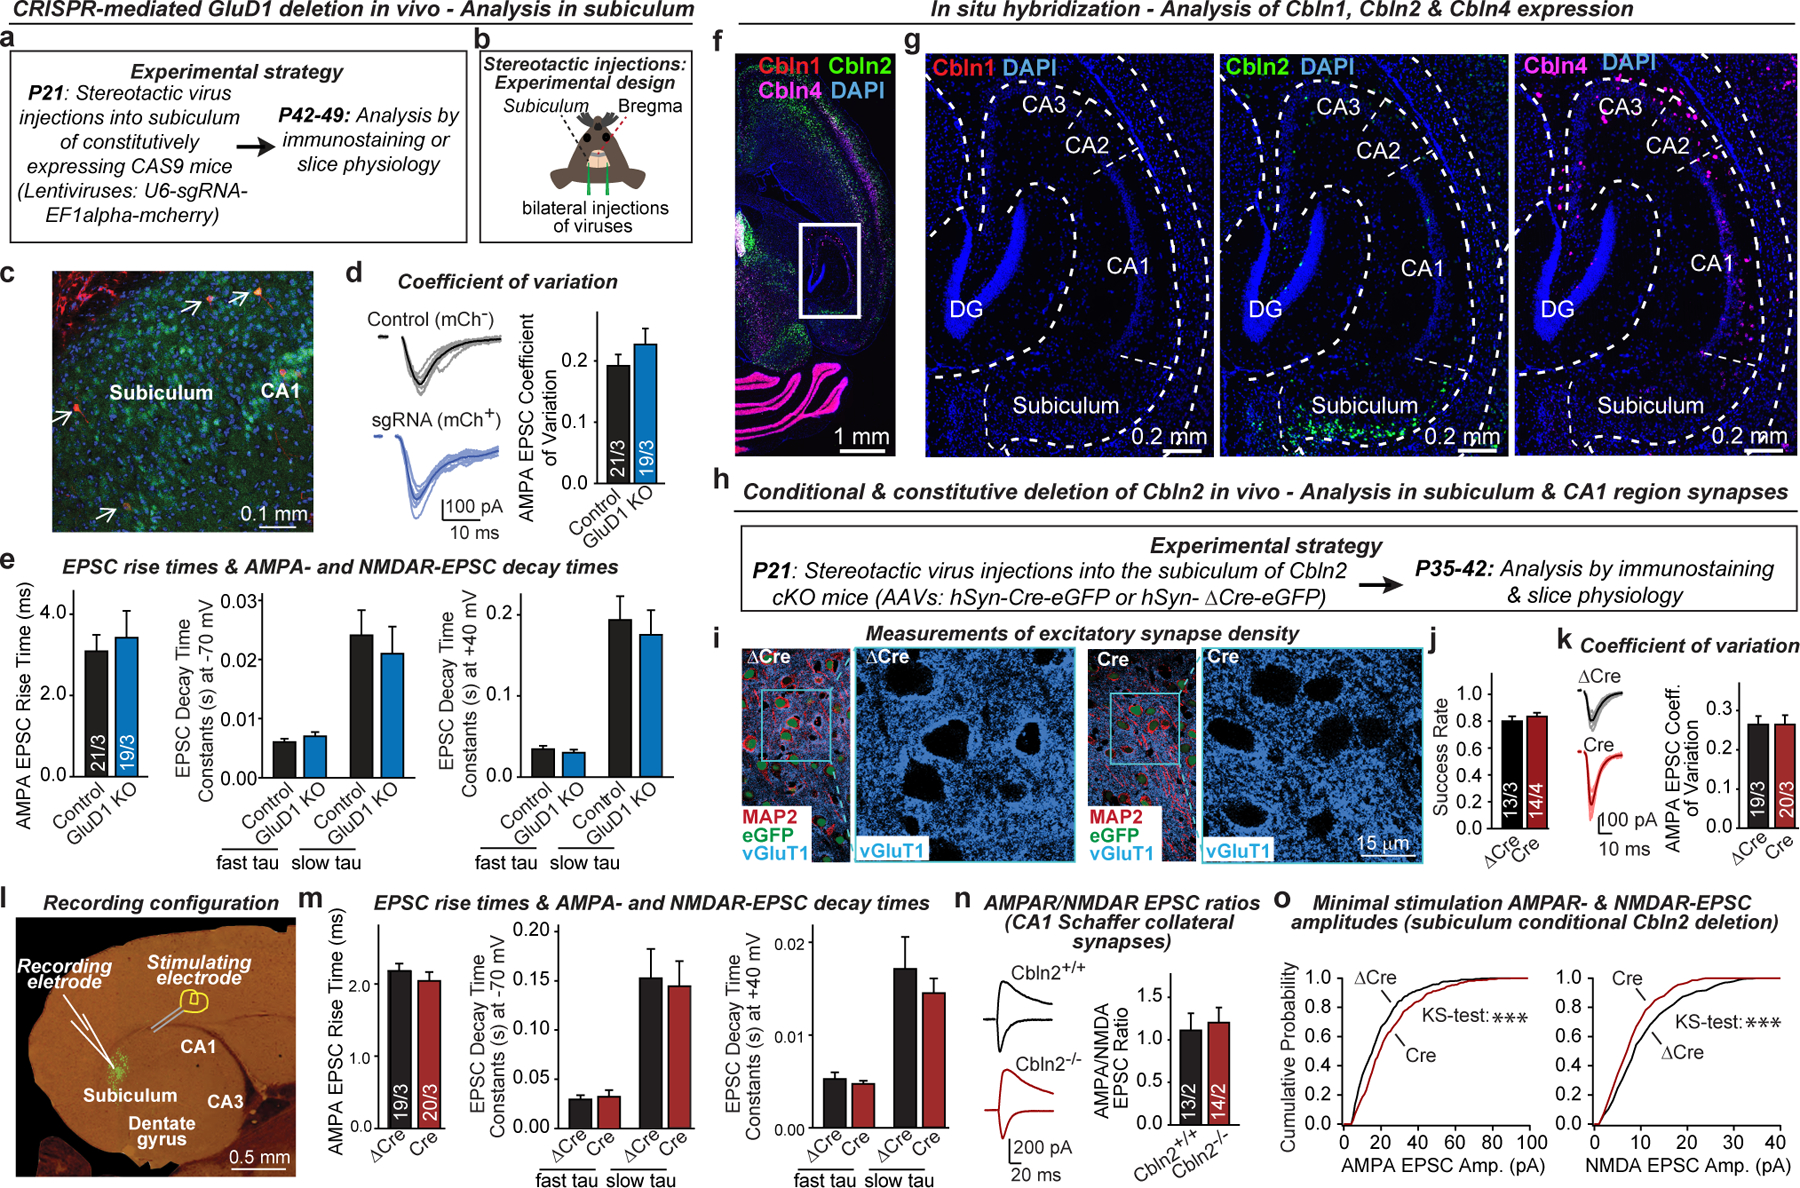
Extended Data Fig. 2. Effects of the CRISPR-mediated deletion of GluD1 and Cre-mediated deletion of Cbln2 in vivo.

a, b, Experimental strategy for CRISPR-mediated sparse GluD1 deletion in neurons of the subiculum in the hippocampal formation. Mice were bilaterally infected at P21 by stereotactic injections of lentiviruses co-expressing sgRNA directed against GluD1 and mCherry. Mice were sacrificed at P42-P49, and subiculum sections were analysed by acute slice physiology comparing adjacent infected mCherry-positive GluD1-deficient neurons with non-infected control neurons (strategy outline (a); diagram of stereotactic injections (b)). c, Image of a subiculum section from a stereotactically infected mouse (representative of 6 experiments). Arrows identify sparsely infected mCherry-positive neurons. d, CRISPR-mediated GluD1 deletion does not alter the coefficient of variation of AMPAR-EPSCs (left, representative traces; right, summary graph of coefficient of variation). e, CRISPR-mediated GluD1 deletion does not alter the EPSC kinetics (left, EPSC rise time (20–80%); middle, EPSC decay constants at −70 mV fitted with double-exponential function; EPSC decay constants at +40 mV fitted with double-exponential function). Data in this panel and panel d were from the experiments in Fig. 1l. f, g, RNA in situ hybridization analyses reveal that cerebellin-1 (Cbln1) is poorly expressed in the hippocampal formation, cerebellin-2 (Cbln2) is detectable only in subiculum neurons, and cerebellin-4 (Cbln4) is found only in a subset of interneurons (overview of the hippocampal formation hybridized for Cbln1, Cbln2, and Cbln4 mRNAs (f); representative images for each cerebellin (g)). Images are representative of multiple brain sections, and match those obtained by the Allen Brain Institute (https://mouse.brain-map.org). h, Experimental strategy for analysis of conditional Cbln2 deletions in vivo using Cbln2 cKO mice19. Mice were bilaterally infected at P21 by stereotactic injections of AAVs expressing ΔCre-eGFP (control) or Cre-eGFP, and subiculum neurons were analysed in acute slices 2–3 weeks later. In this and all following experiments, ΔCre refers to the expression of a mutant inactive Cre that is otherwise indistinguishable from Cre. i, Conditional Cbln2 deletion from subiculum neurons does not impair excitatory synapse numbers (representative images complementing those shown in Fig. 2a). j, Summary graph of the EPSC success rate during minimal stimulation experiments (Fig. 2d). k, Conditional Cbln2 deletion does not alter the coefficient of variation of AMPAR-EPSCs (left, representative traces; right, summary graph of coefficient of variation). l, Image of an acute slice of the hippocampal formation from a mouse infected with AAVs expressing Cre-eGFP (green), and illustration of the electrophysiological recording configuration. m, Conditional Cbln2 deletion does not alter the EPSC kinetics (left, EPSC rise time (20–80%); middle, EPSC decay constants at −70 mV fitted with double-exponential function; EPSC decay constants at +40 mV fitted with double-exponential function). Data in this panel and panel k were from the experiments shown in Fig. 2c. n, Constitutive Cbln2 deletion does not alter the AMPA/NMDA EPSC ratio at CA3-CA1 Schaffer collateral synapses (left, representative traces; right, summary graph). Both conditional and constitutive Cbln2 deletions cause a massive change in this ratio when analysed in subiculum synapses (see Fig. 2). o, Cumulative probability plots show that the conditional Cbln2 deletion in subiculum significantly shifts the distribution of AMPAR-EPSC amplitudes the right and of NMDAR-EPSC amplitudes to the left, as analysed during minimal stimulation experiments. Data are means ± s.e.m. (number of neurons/mice is indicated in the bars of d, e, j, k, m, n). Statistical significance was assessed by two-tailed Student’s t-test or two sample K-S test (*P ≤ 0.05, **P ≤ 0.01, and ***P ≤ 0.001; for exact P values, see source data; non-significant relations are not indicated).
