
Figure 2.
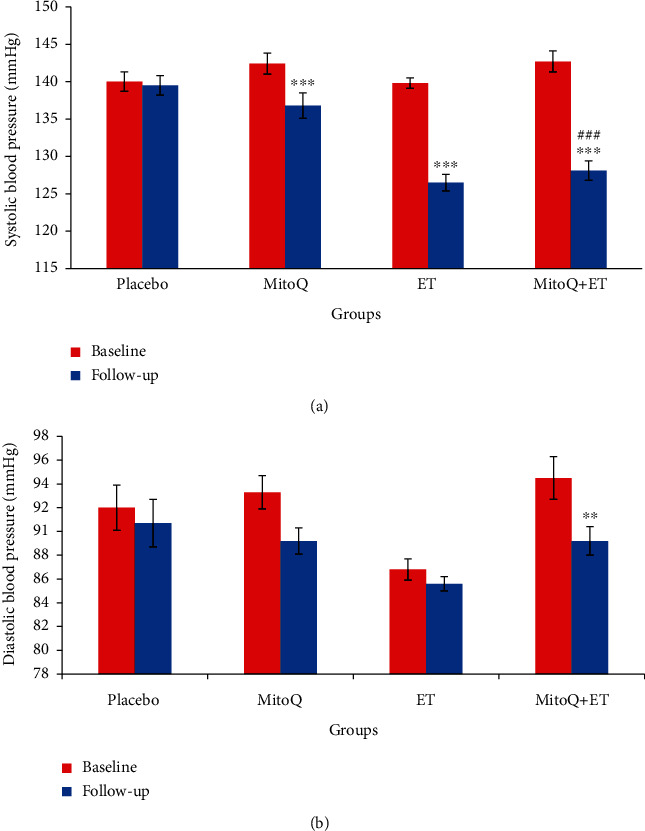
Baseline and follow-up systolic and diastolic blood pressure values (a, b) in the four groups of the study after 6 weeks of ET and MitoQ+ET supplementation (n = 13 in each group). Data are expressed as mean ± SEM. ∗∗p < 0.01, ∗∗∗p < 0.001 vs. related baseline. #Significant difference vs. MitoQ follow-up. ET: endurance training.