
Figure 2.
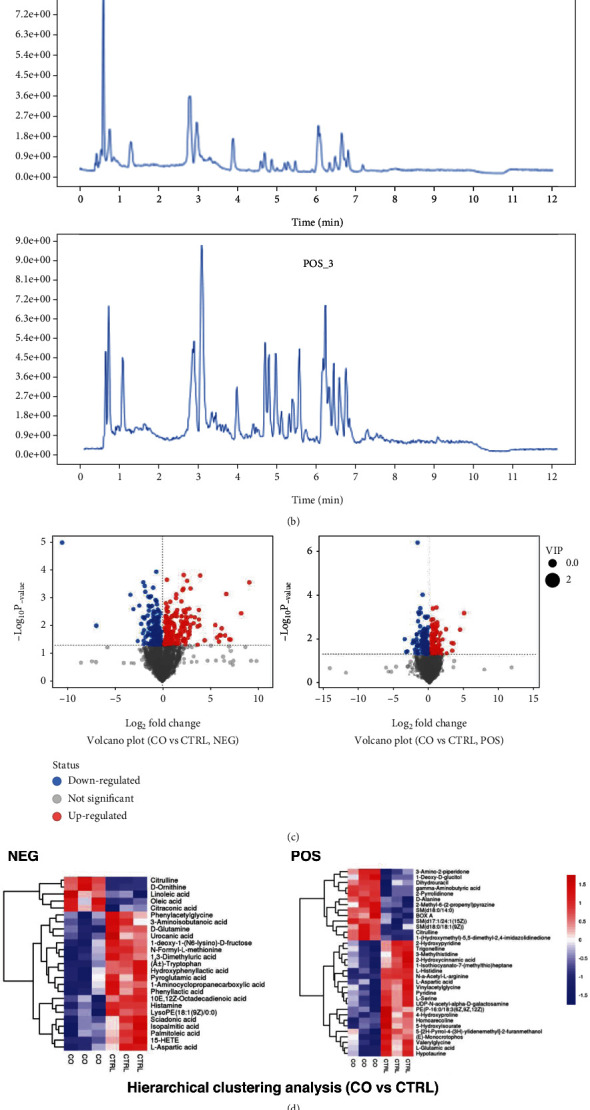
(a) OPLS-DA score scatter plot. Each point represents a sample; (b) representative chromatograms in positive (POS) and negative (NEG) ion modes; (c) volcano plot of differential metabolite analysis. The dotted line indicates the threshold of the differential metabolites selected; (d) cluster analysis of differential metabolites; (e) pathway analysis.