
Figure 4.
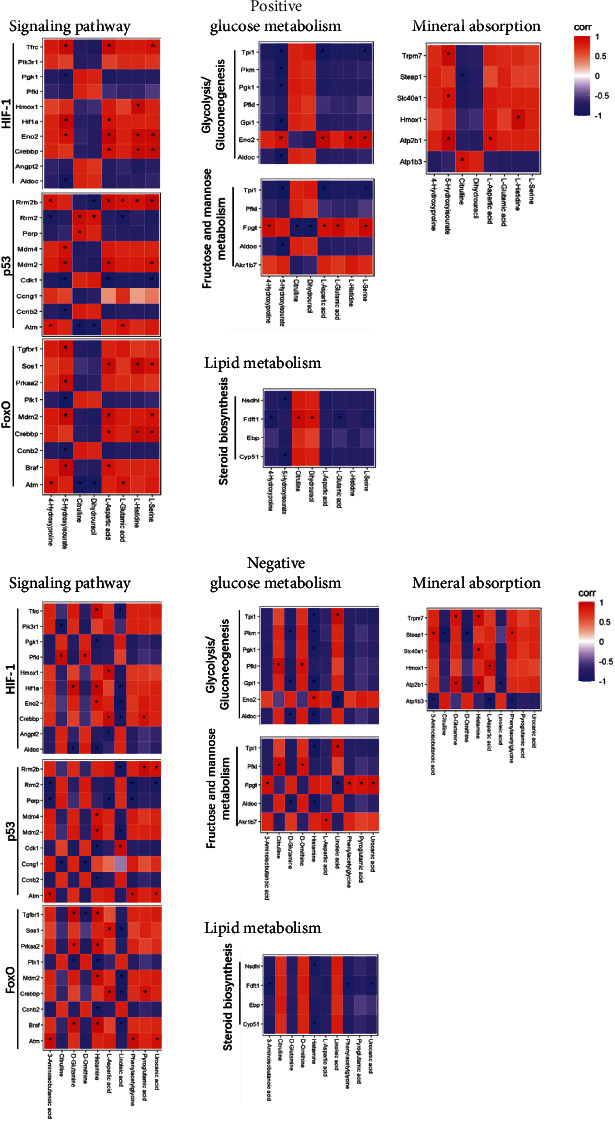
Heatmap indicating the correlation between the differential transcripts and metabolites. Red (corr = 1), blue (corr = −1), and white (corr = 0); ∗P < 0.05 for Spearman correlation.
Official websites use .gov
A
.gov website belongs to an official
government organization in the United States.
Secure .gov websites use HTTPS
A lock (
) or https:// means you've safely
connected to the .gov website. Share sensitive
information only on official, secure websites.
Heatmap indicating the correlation between the differential transcripts and metabolites. Red (corr = 1), blue (corr = −1), and white (corr = 0); ∗P < 0.05 for Spearman correlation.