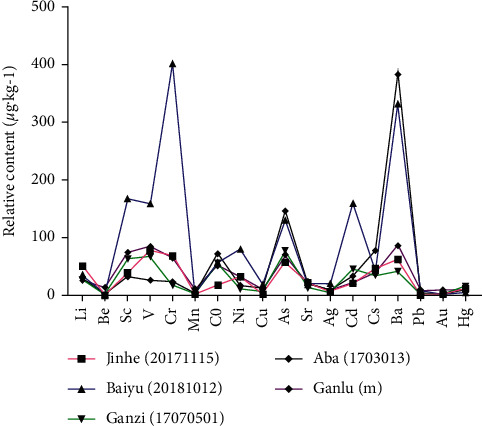
Figure 4.

Intuitive analysis of the determination of trace elements in samples of QSW. (The peak shapes of different manufacturers are different, indicating that the content of trace elements in QSW of different manufacturers is quite different.) Ganlu (m) represents the average value of Ganlu's 6 batches of QSW. Expansion 10 times: Li, Be, V Co. Expansion 100 times: Sc, Cd, Cs. Reduction 10 times: As, Sr. Reduction 100 times: Mn, Ag, Au. Reduction 1000 times: Cu, Hg, Pb.
