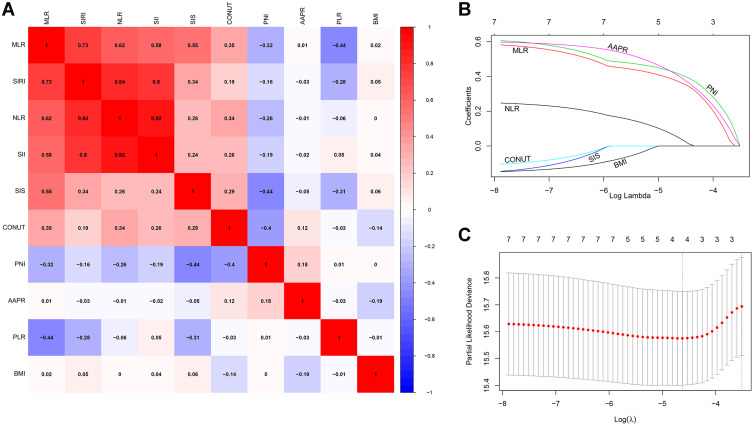
Figure 2.
Construction of the INPS by using LASSO Cox regression model. (A) A correlation matrix with correlation coefficients from −1 (negative correlation; blue) to 1 (positive correlation; red). (B) LASSO coefficient profiles of the 10 inflammatory- nutritional biomarkers. The horizontal axis (bottom) represented the log(λ) value of the independent variable, the horizontal axis (top) represented the number of variables with non-zero coefficient, the vertical axis represented the coefficient of the independent variable, and each curve represented the variation trajectory of the coefficient of each independent variable. (C) Ten-fold cross‐validation for tuning parameter selection in the LASSO model. The dotted vertical lines were drawn at the best value of log(λ) by using the minimum criteria and 1-SE criteria. Solid vertical lines represented partial likelihood deviance ± SE. The intersection point of the left dotted line and the abscissa axis (bottom) showed the optimal value of log(λ), the corresponding value in the abscissa axis (top) showed the number of variables with non-zero coefficient identified at the optimal log(λ).
Abbreviations: INPS, inflammatory-nutritional prognostic scoring; BMI, body mass index; NLR, neutrophil-lymphocyte ratio; PLR, platelet-lymphocyte ratio; MLR, monocyte-lymphocyte ratio; SII, systemic immune inflammation index; PNI, prognostic nutritional index; SIRI, system inflammation response index; CONUT, controlling nutritional status; SIS, systemic inflammation score; AAPR, albumin-alkaline phosphatase ratio; SE, standard error.

