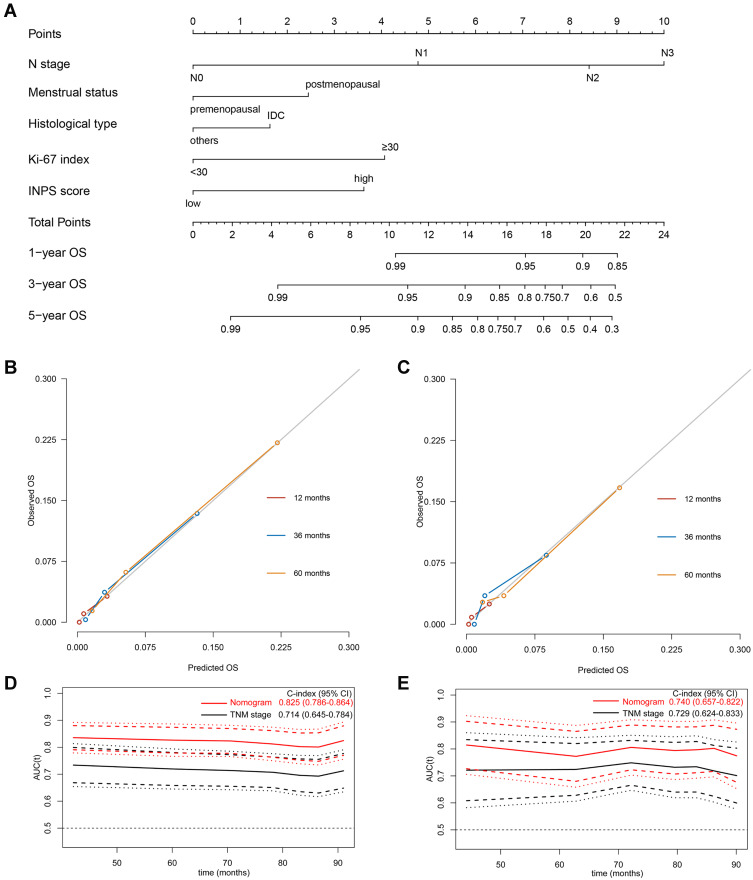
Figure 5.
Development and validation of the prognostic model. (A) A nomogram of the current prognostic model for individualized survival predictions. (B) Calibration plot of the nomogram model at 1-, 3-, and 5-year in the training cohort. (C) Calibration plot of the nomogram model at 1-, 3-, and 5-year in the validation cohort. (D) Time-independent ROC curves compared the predictive accuracy (C-index with its 95% CI) of the current model (the red line) and the traditional TNM stage (the black line) in the training cohort. (E) Time-independent ROC curves compared the predictive accuracy (C-index with its 95% CI) of the current model (the red line) and the traditional TNM stage (the black line) in the validation cohort.
Abbreviations: OS, overall survival; ROC, receiver operating characteristic; INPS, inflammatory-nutritional prognostic scoring; CI, confidence interval.

