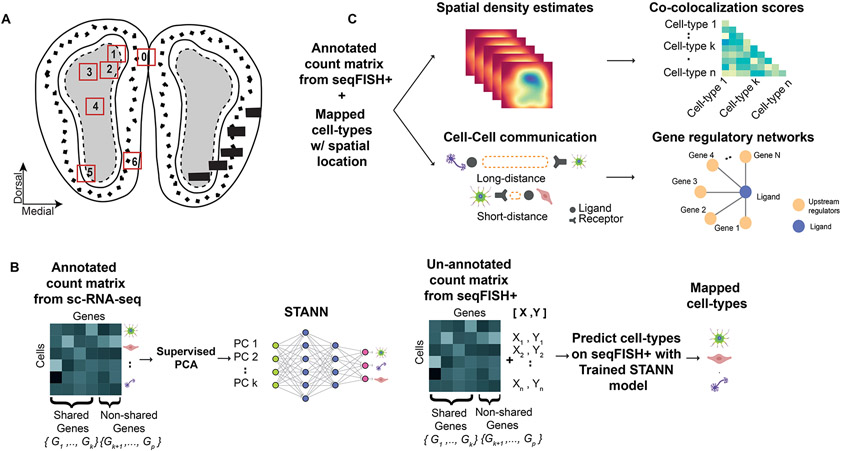
Figure 1.
Mouse olfactory bulb (MOB) architecture and an outline of the STANN model with the downstream analyses. A) A schematic showing the layered architecture of MOB. The numbered boxes show the locations of the six fields of views (FOVs) in the MOB seqFISH+ data. B) Learning stage of STANN, model training on annotated scRNA-seq data. C) Downstream analyses on cell-type annotated seqFISH+ data: spatial density maps of locations of cell-types, colocalization scores, intercellular communication, and gene regulatory networks.

