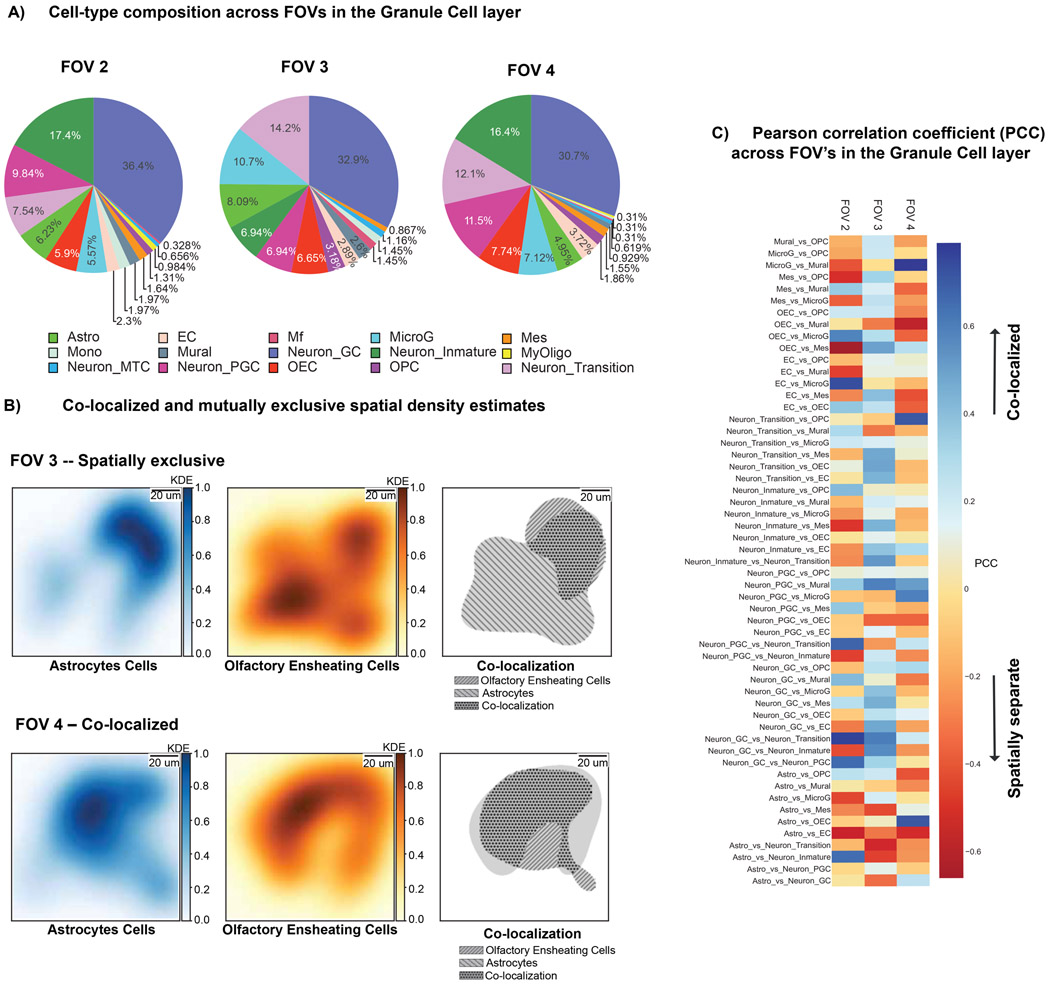
Figure 4.
Consistency of cell-type composition and variation of cellular colocalization in the same MOB layer. A) Composition of cell-types across different FOVs in the Granule Cell Layer (GCL). B) Kernel density maps of Neuronal Transition cells vs. Olfactory Ensheathing cells in two different FOVs located in the GCL layer, showing completely opposite co-colocalization patterns. Color bar represents in linear scale the Pearson Correlation Coefficients (PCC). C) Heatmap of PCC scores of cellular colocalization within FOVs located in the GCL.

