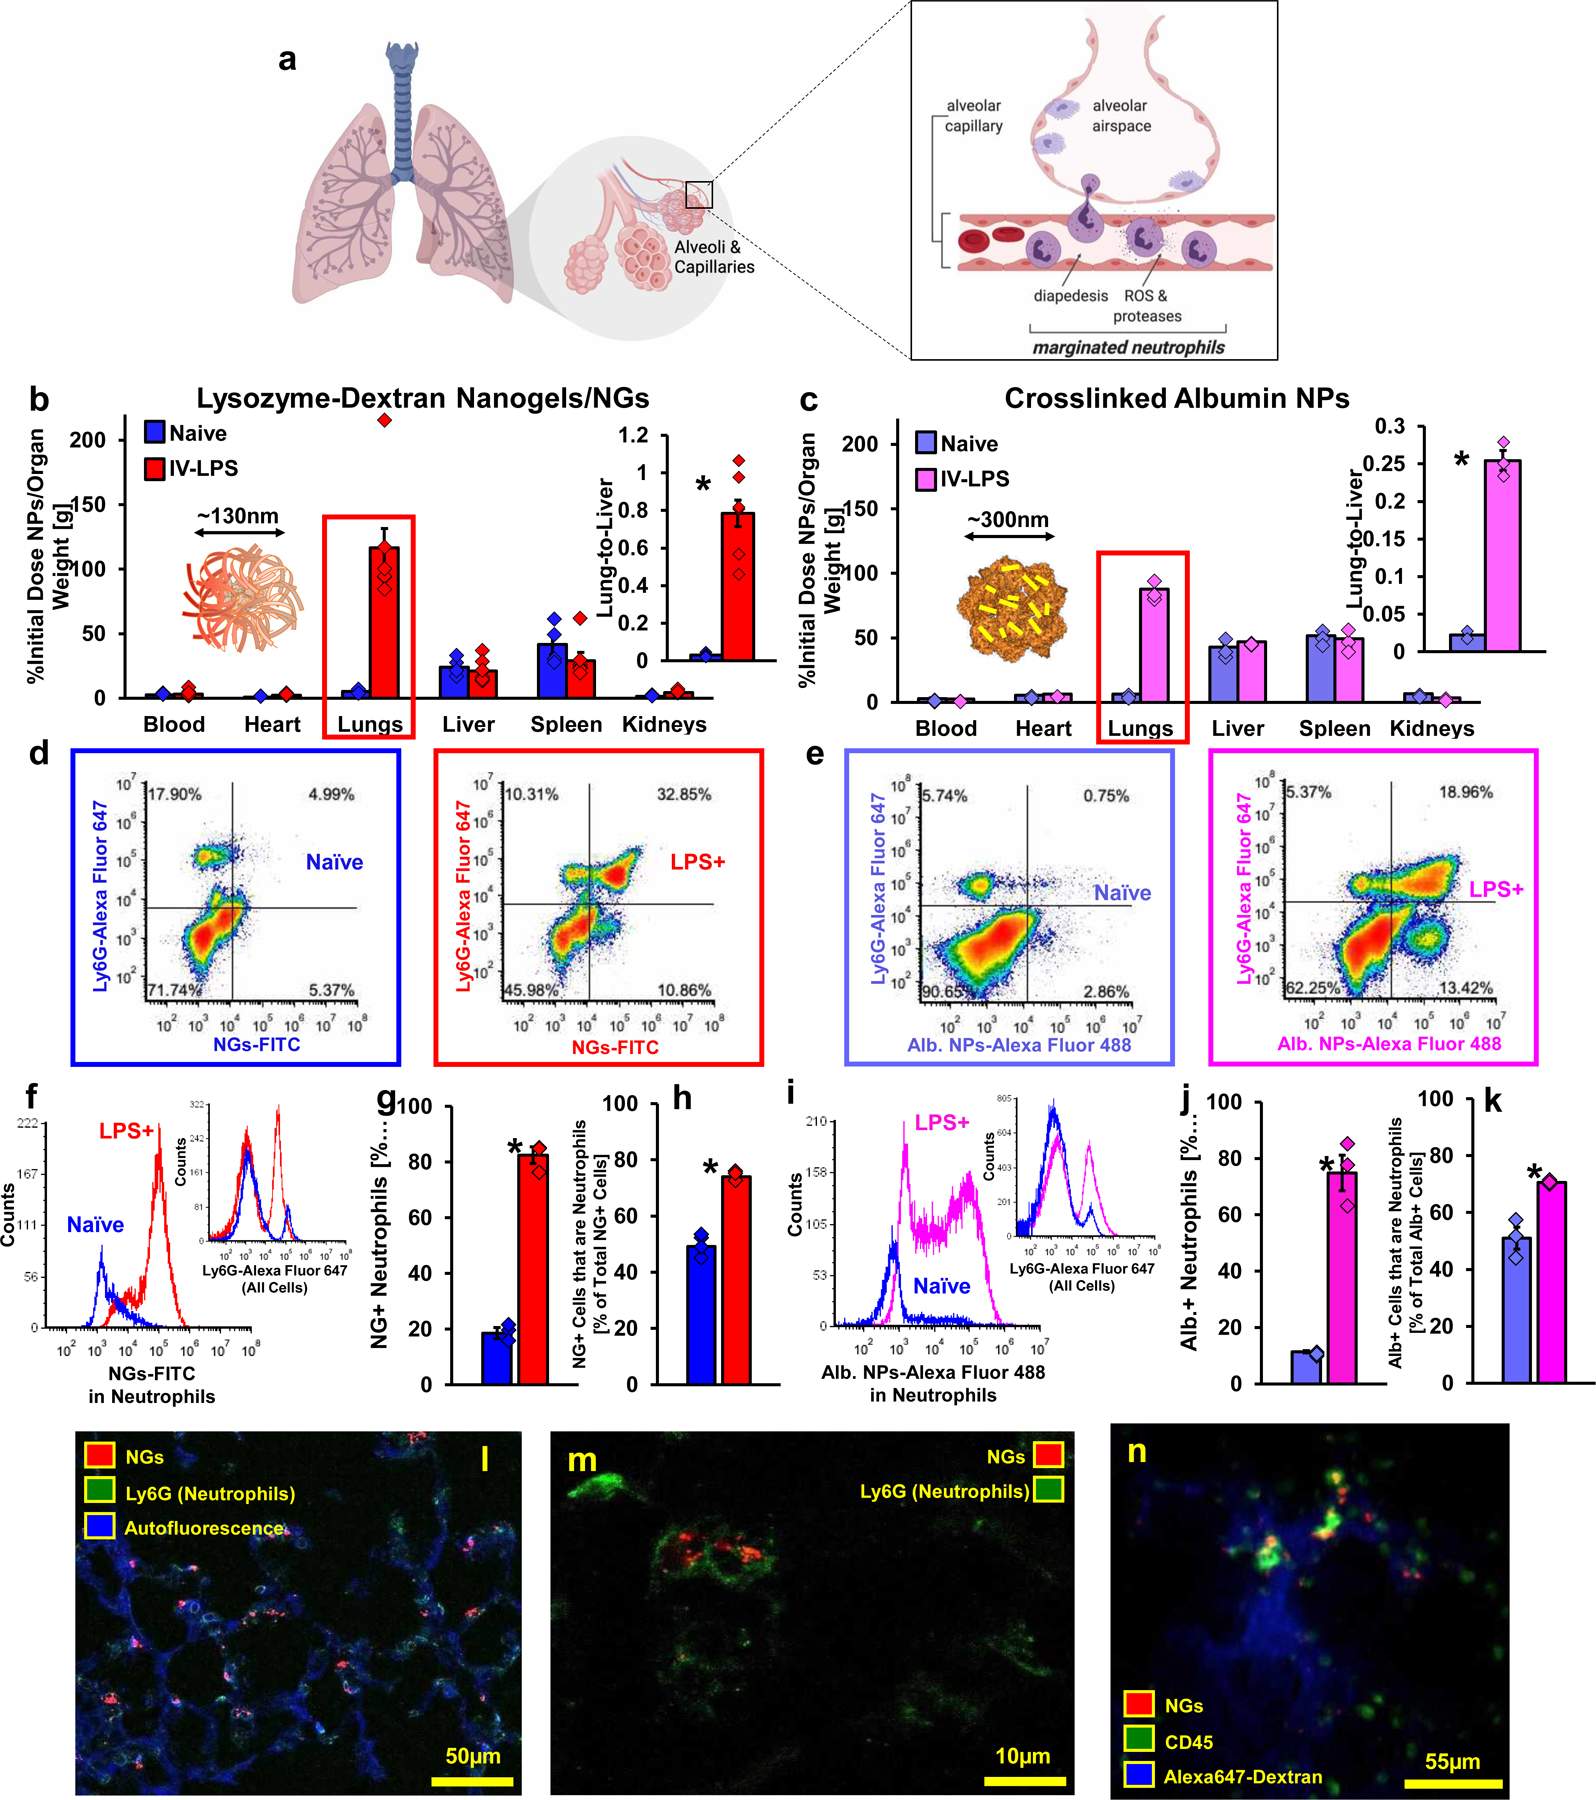
Figure 1. Lysozyme-Dextran Nanogels and Crosslinked Albumin Nanoparticles Accumulate in Marginated Neutrophils in Inflamed Lungs.

(a) Schematic of neutrophil margination and extravasation in inflamed lungs (created with BioRender.com). (b) Biodistributions of lysozyme-dextran nanogels (NGs) in naïve (n=4 animals) and IV-LPS-affected (n=8 animals) male C57BL/6 mice (red box: p<1×10⁻¹⁰, *: p=0.00008). (c) Biodistributions of PEG-NHS crosslinked human albumin nanoparticles (albumin NPs) in naïve (n=3 animals) and IV-LPS-injured (n=3 animals) mice (red box: p<1×10⁻¹⁰, *: p=0.004). (d-k) Flow cytometry characterization of single cell suspensions prepared from naïve and IV-LPS-affected mouse lungs. (d-e) Vertical axis indicates Ly6G staining for neutrophils and horizontal axis indicates signal from fluorescent NGs (d) or fluorescent albumin NPs (e). (f/h) NG/albumin NP fluorescent signal from neutrophils in IV-LPS-injured mouse lungs (red/pink), compared to naïve lungs (blue) (inset: Flow cytometry data verifying increased neutrophil concentration in IV-LPS-injured mouse lungs (red/pink). (g-h, j-k) Fraction of neutrophils positive for NGs (g) or albumin NPs (j) in naïve or IV-LPS-injured lungs and fraction of NG-positive (h) or albumin NP-positive (k) cells that are neutrophils. For (g-h), NGs/naïve: n=4 animals, NGs/LPS: n=4 animals. For (j-k), albumin NPs/naïve: n=3 animals, albumin NPs/LPS: n=3 animals. (g)*: p=2.6×10⁻⁷. (h)*: p=1.7×10⁻⁵. (j)*: p=0.0006. (k)*: p=0.007. (l-m) Fluorescence micrographs indicating association of NGs (red) with neutrophils (green, Ly6G stain) in the lungs of an IV-LPS-affected mouse (blue, tissue autofluorescence). Data are from histology for two naïve mice and two IV-LPS affected mice. (n) Single frame from real-time intravital imaging of NG (red) uptake in leukocytes (green) in the lungs of one IV-LPS-affected mouse (blue, Alexa Fluor 647-dextran). Statistical significance in (b) and (c) is derived from two-way ANOVA with Sidak’s multiple comparisons test. Statistical significance in (g), (h), (j), and (k) is derived from paired two-tailed t-tests. All error bars indicate mean ± SEM.
