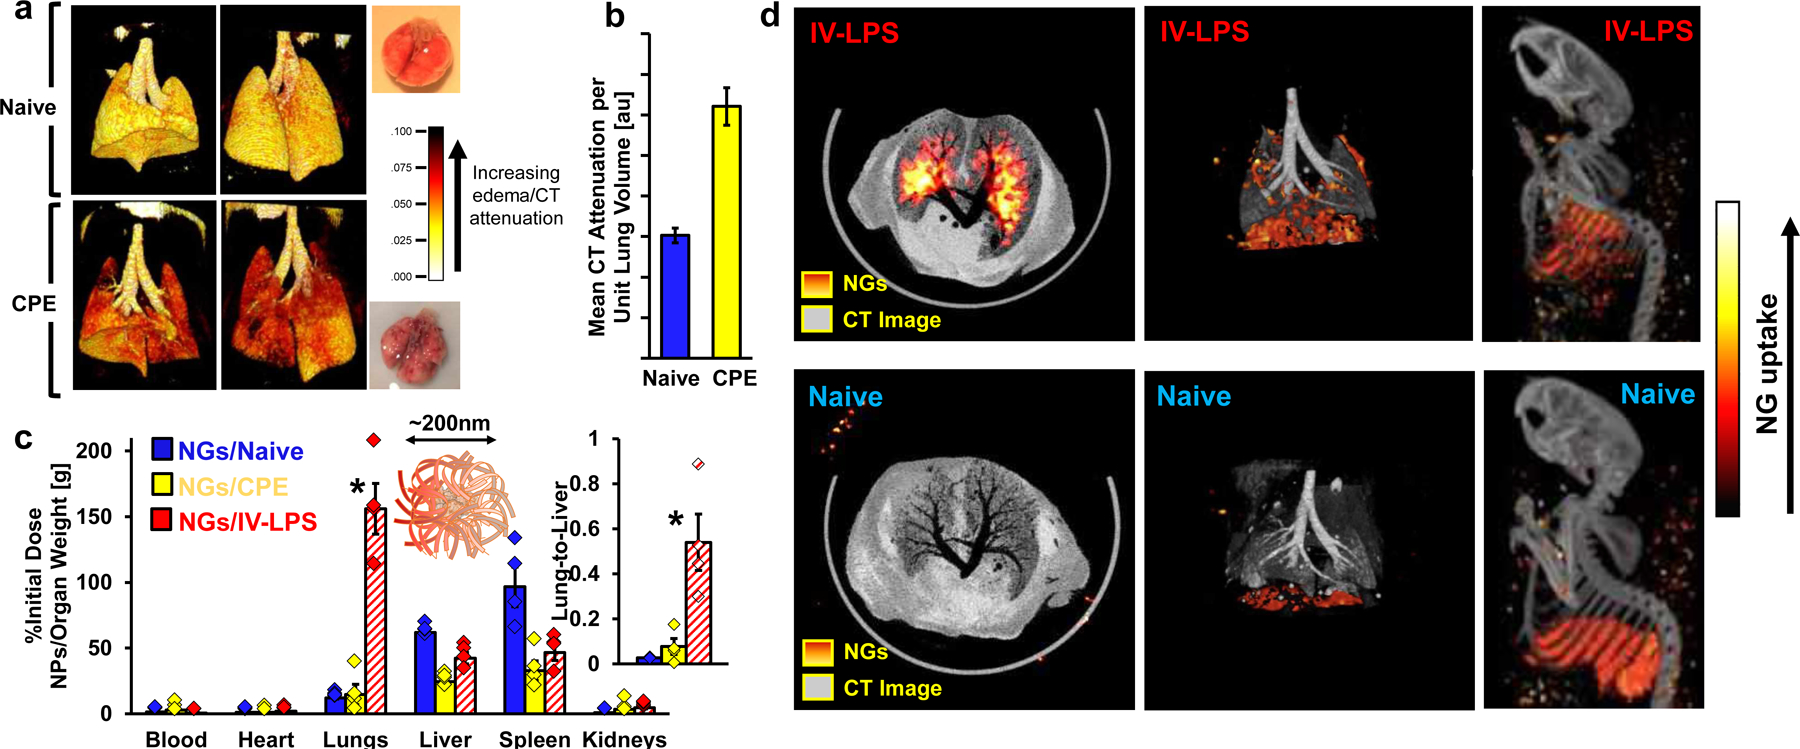
Figure 5. Specificity of NAPs for LPS-Inflamed Lungs vs. Edematous Lungs and SPECT Imaging of NAPs in LPS-Inflamed Lungs.

(a) Three-dimensional reconstructions of chest CT data for naïve mouse lungs and lungs with cardiogenic pulmonary edema (CPE). White/yellow indicates lower attenuation, corresponding to airspace in healthy lungs. Red/dark background indicates higher attenuation, corresponding to fluid in the lungs. (b) Quantification of CT attenuation in naive (blue) and edematous (yellow) lungs, averaged across axial slices (individual slice values in supplementary figure 32). (c) Biodistributions of 200 nm lysozyme-dextran nanogels in naïve mice, mice treated with IV-LPS, and mice subject to cardiogenic pulmonary edema (n=4 animals). Naïve and IV-LPS data is identical to that presented in supplementary figure 13, upper right panel. For comparison of CPE and IV-LPS values, *: p<1×10⁻¹⁰ for main panel and p=0.005 for inset. (d) Co-registered CT (greyscale) and SPECT (red-yellow) images indicating 111In- labeled lysozyme-dextran nanogel uptake in a naïve and an IV-LPS-affected mouse. White/yellow indicates more nanogel uptake. Red/dark background indicates less lysozyme-dextran nanogel uptake. Statistical significance in (c) is derived from two-way ANOVA with Tukey’s multiple comparisons test. All error bars indicate mean ± SEM.
