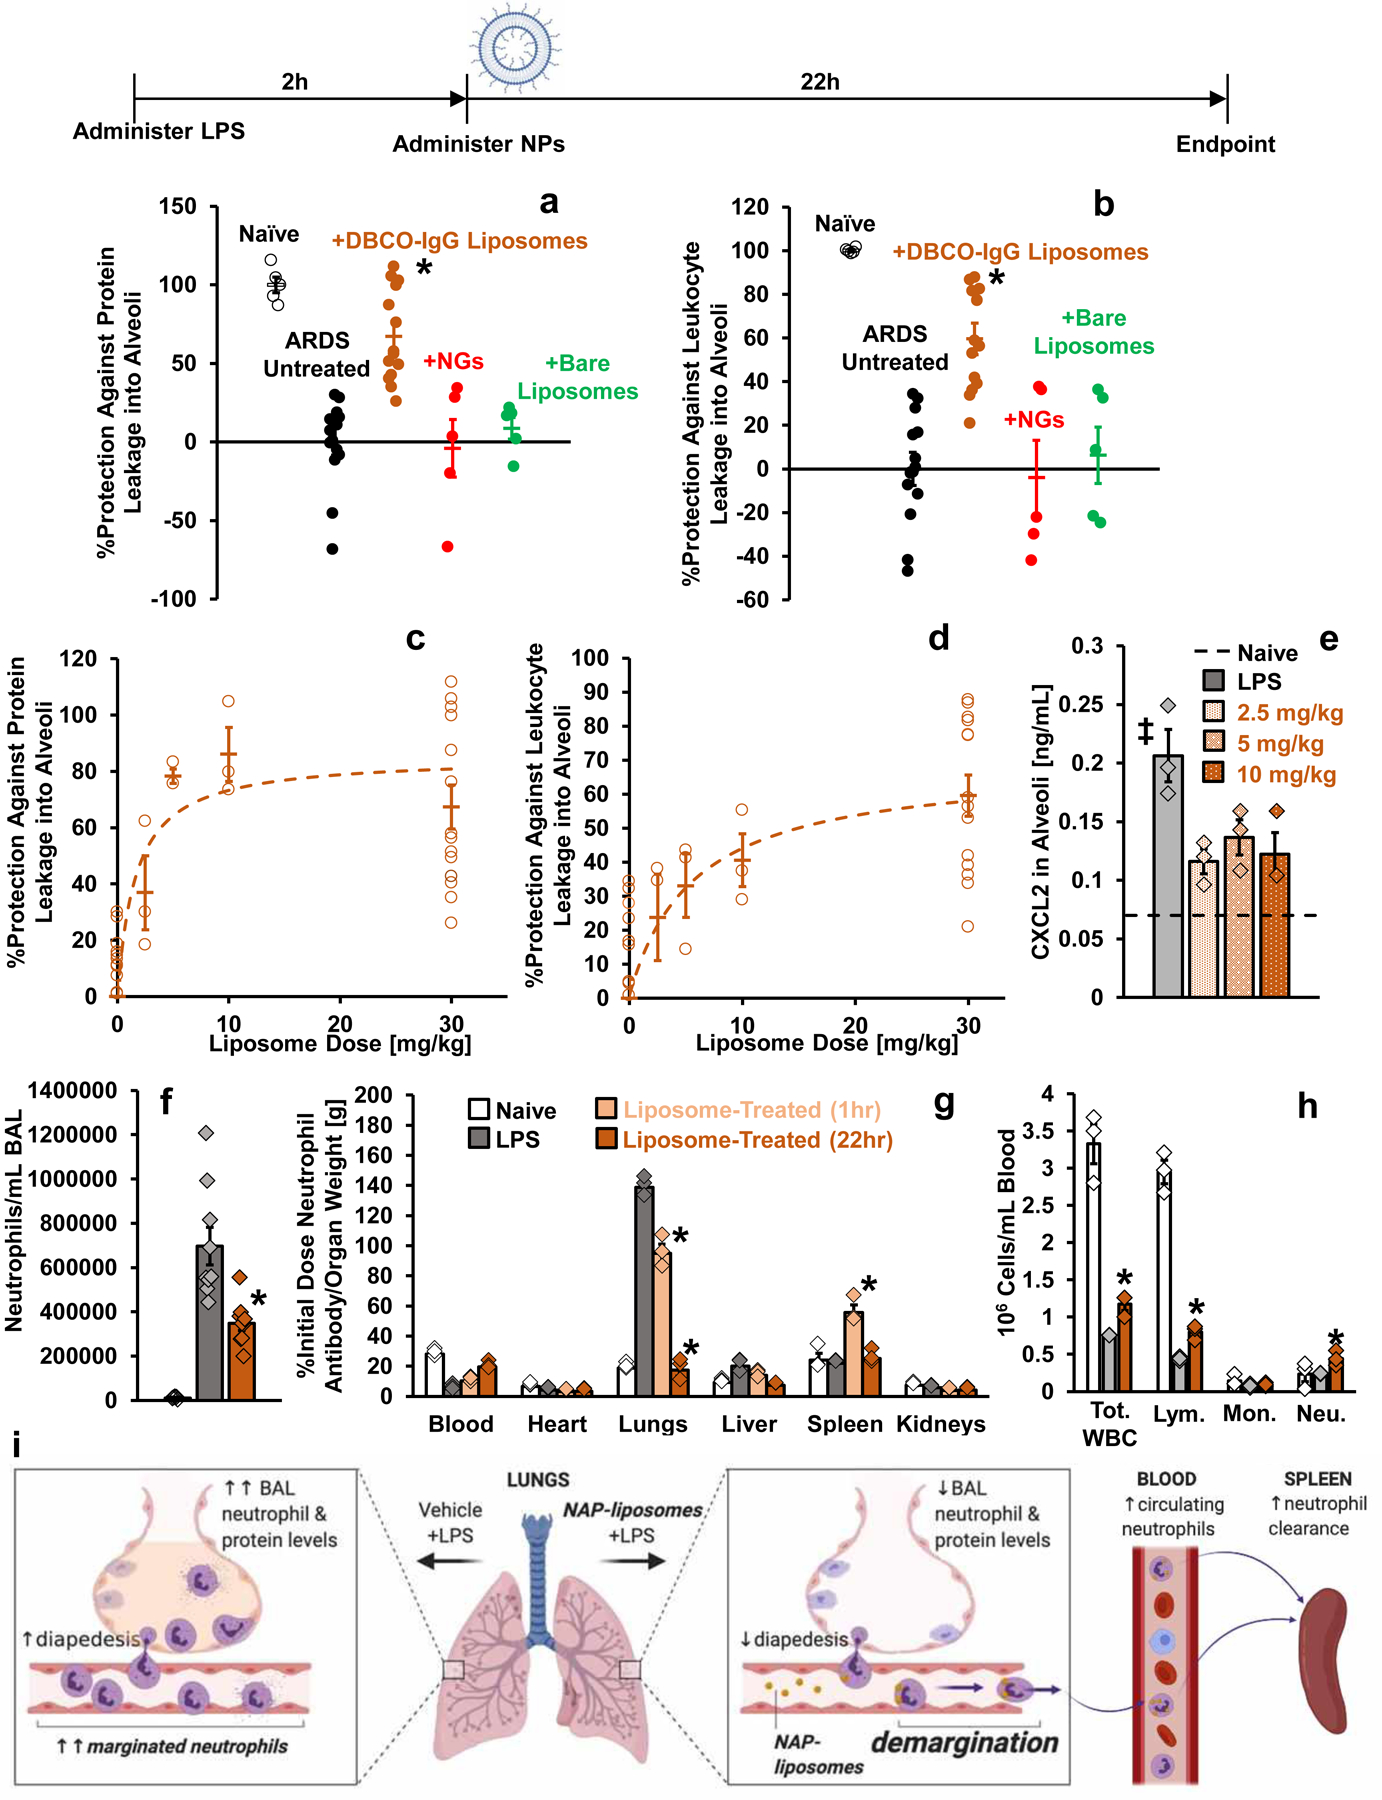
Figure 6. Effects of NAPs in Model Acute Respiratory Distress Syndrome.

Timeline: Nanoparticles or vehicle were administered as an IV bolus two hours after nebulized LPS administration (Liposome schematic created with BioRender.com). (a-b) Bronchoalveolar lavage fluid (BALF) was harvested 22 hours after nanoparticle (30 mg/kg) or vehicle administration. (a) Protein concentration in BALF, reflecting quantity of edema in naïve mice (n=5 animals), sham-treated mice with model ARDS (n=15 animals), and mice with model ARDS treated with DBCO-IgG liposomes (n=14 animals), NGs (n=5 animals), or bare PEGylated liposomes (n=5 animals). *: p=6.6×10⁻⁷, 0.0001, and 0.002 for comparison of DBCO-IgG liposome treatment with sham treatment, NG treatment, and bare liposome treatment, respectively. (b) Concentration of leukocytes in BALF for same groups as in (a). *: p=1.1×10⁻⁶, 0.0001, and 0.002 for comparison of DBCO-IgG liposome treatment with sham treatment, NG treatment, and bare liposome treatment, respectively. Quantities in (a-b) are represented as degree of protection against infiltration into alveoli, extrapolated from levels in naïve mice (100% protection) and untreated mice with model ARDS (0% protection). (c-d) Dose-response for edema (c) and leukocyte infiltration (d) in alveoli of ARDS mice treated with DBCO-IgG liposomes. Data were obtained as in (a-b), but with different liposome doses (n=3 animals for 2.5 mg/kg, 5 mg/kg, and 10 mg/kg liposome doses). (e) Chemokine CXCL2 levels in alveoli of LPS-injured mice with and without DBCO-IgG liposome treatment (n=3 animals for all groups). Dashed line indicates CXCL2 levels in alveoli of naïve mice. ‡: p=0.024, 0.079, and 0.034 for comparison of sham treatment with 2.5 mg/kg, 5 mg/kg, and 10 mg/kg DBCO-IgG liposomes treatment, respectively. (f) Concentration of neutrophils in BALF of naïve mice (n=5 animals), mice with model ARDS (n=9 animals), and mice with model ARDS dosed with 30 mg/kg DBCO-IgG liposomes (n=9 animals). For comparison of DBCO-IgG liposome treatment to sham treatment, *: p=0.009. (g) Biodistributions of anti-Ly6G antibody in naïve mice (n=3 animals), LPS-injured mice (n=3 animals), and mice treated with 10 mg/kg DBCO-IgG liposomes, with organs sampled at 1 hour after treatment (n=3 animals) or 22 hours after treatment (n=3 animals). Naïve and untreated LPS-affected data are identical to data in supplementary figure 1a. *: p<1×10⁻¹⁰ for all comparisons of anti-Ly6G uptake in lungs or spleen of liposome-treated mice vs. sham treated mice. (h) Complete blood count analysis of circulating leukocyte concentrations in naïve mice (n=3 animals), LPS-injured mice (n=3 animals), and mice treated with 10 mg/kg DBCO-IgG liposomes, with blood sampled 22 hours after treatment (n=3 animals). *: p=0.019, 0.025, and 0.047 for comparison of DBCO-IgG liposome-treated to sham-treated values for total white blood cell, lymphocyte, and neutrophil counts, respectively. (i) Schematic for the fate of neutrophils in mice with model ARDS, with and without DBCO-IgG liposome treatment, based on data in (f-h) (created with BioRender.com). Statistical significance in (a), (b), (e), and (f) is derived from one-way ANOVA with Tukey’s multiple comparisons test. Statistical significance in (g-h) is derived from two-way ANOVA with Tukey’s multiple comparisons test. All error bars indicate mean ± SEM.
