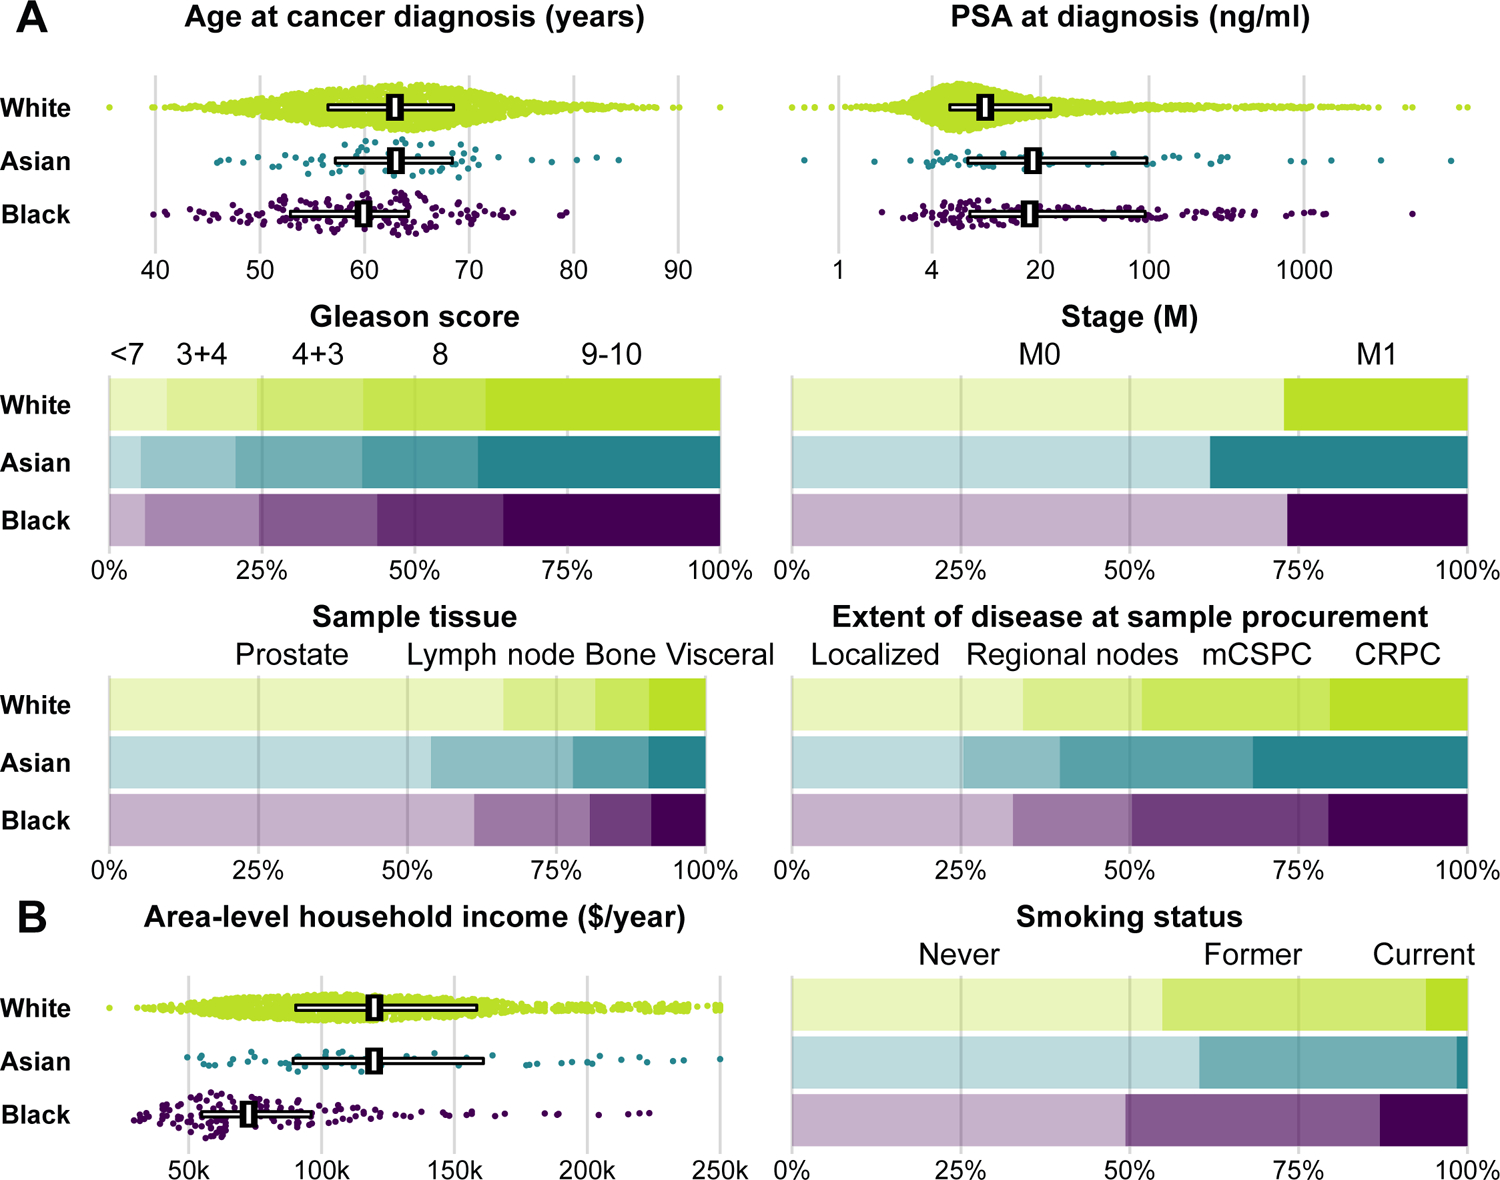
Figure 1.

A, Clinical factors and B, cancer risk factors by self-reported race. For age, prostate-specific antigen, and area-level household income, individual data points are shown, with horizontal bars covering the 25th to 75th percentile and vertical bars indicating the median. For other characteristics, bars indicate proportions. PSA, prostate-specific antigen; CRPC, castration-resistant prostate cancer.
