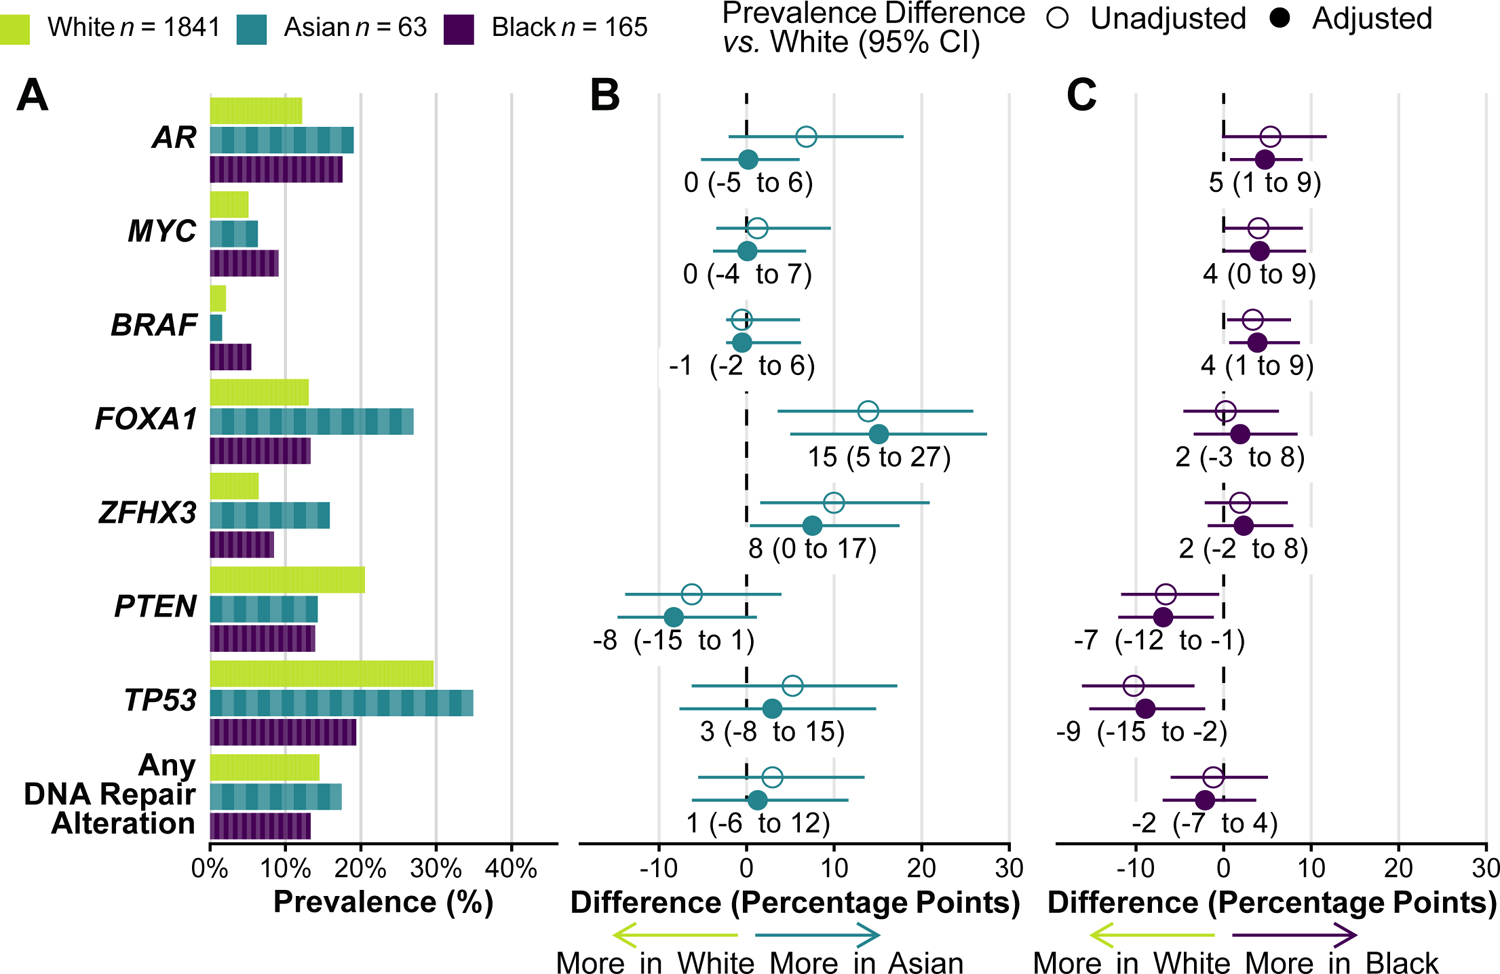
Figure 2.

Self-reported race and tumor alterations. A, Prevalence of oncogenic alterations by self-reported race. Prevalence is a proportion; each “brick” represents one patient with an alteration (not visible for White men because of the high number). B, Differences in alteration prevalence, comparing Asian men vs. White men. C, Differences in alteration prevalence, comparing Black men vs. White men. Panels B and C show absolute differences in percentage points. Adjusted models include age at sample (linear), disease extent (localized, regional nodes, metastatic hormone-sensitive, or castration-resistant), prostate-specific antigen (PSA) levels at diagnosis (loge-transformed, mean-imputed), stage at diagnosis (de novo metastatic vs. non-metastatic), and sample type (prostate, lymph node, bone, or visceral). Individual genes are ordered by prevalence difference in Black men vs. White men. Only 1,924 samples (93%) were profiled for ZFHX3 due to its inclusion in a later panel version. For comparability with (8), DNA repair alterations encompass ERCC5, MRE11, TP53BP1, POLE, RAD21, MSH2, MSH6, BRCA1, BRCA2, ATR, and ATM.
