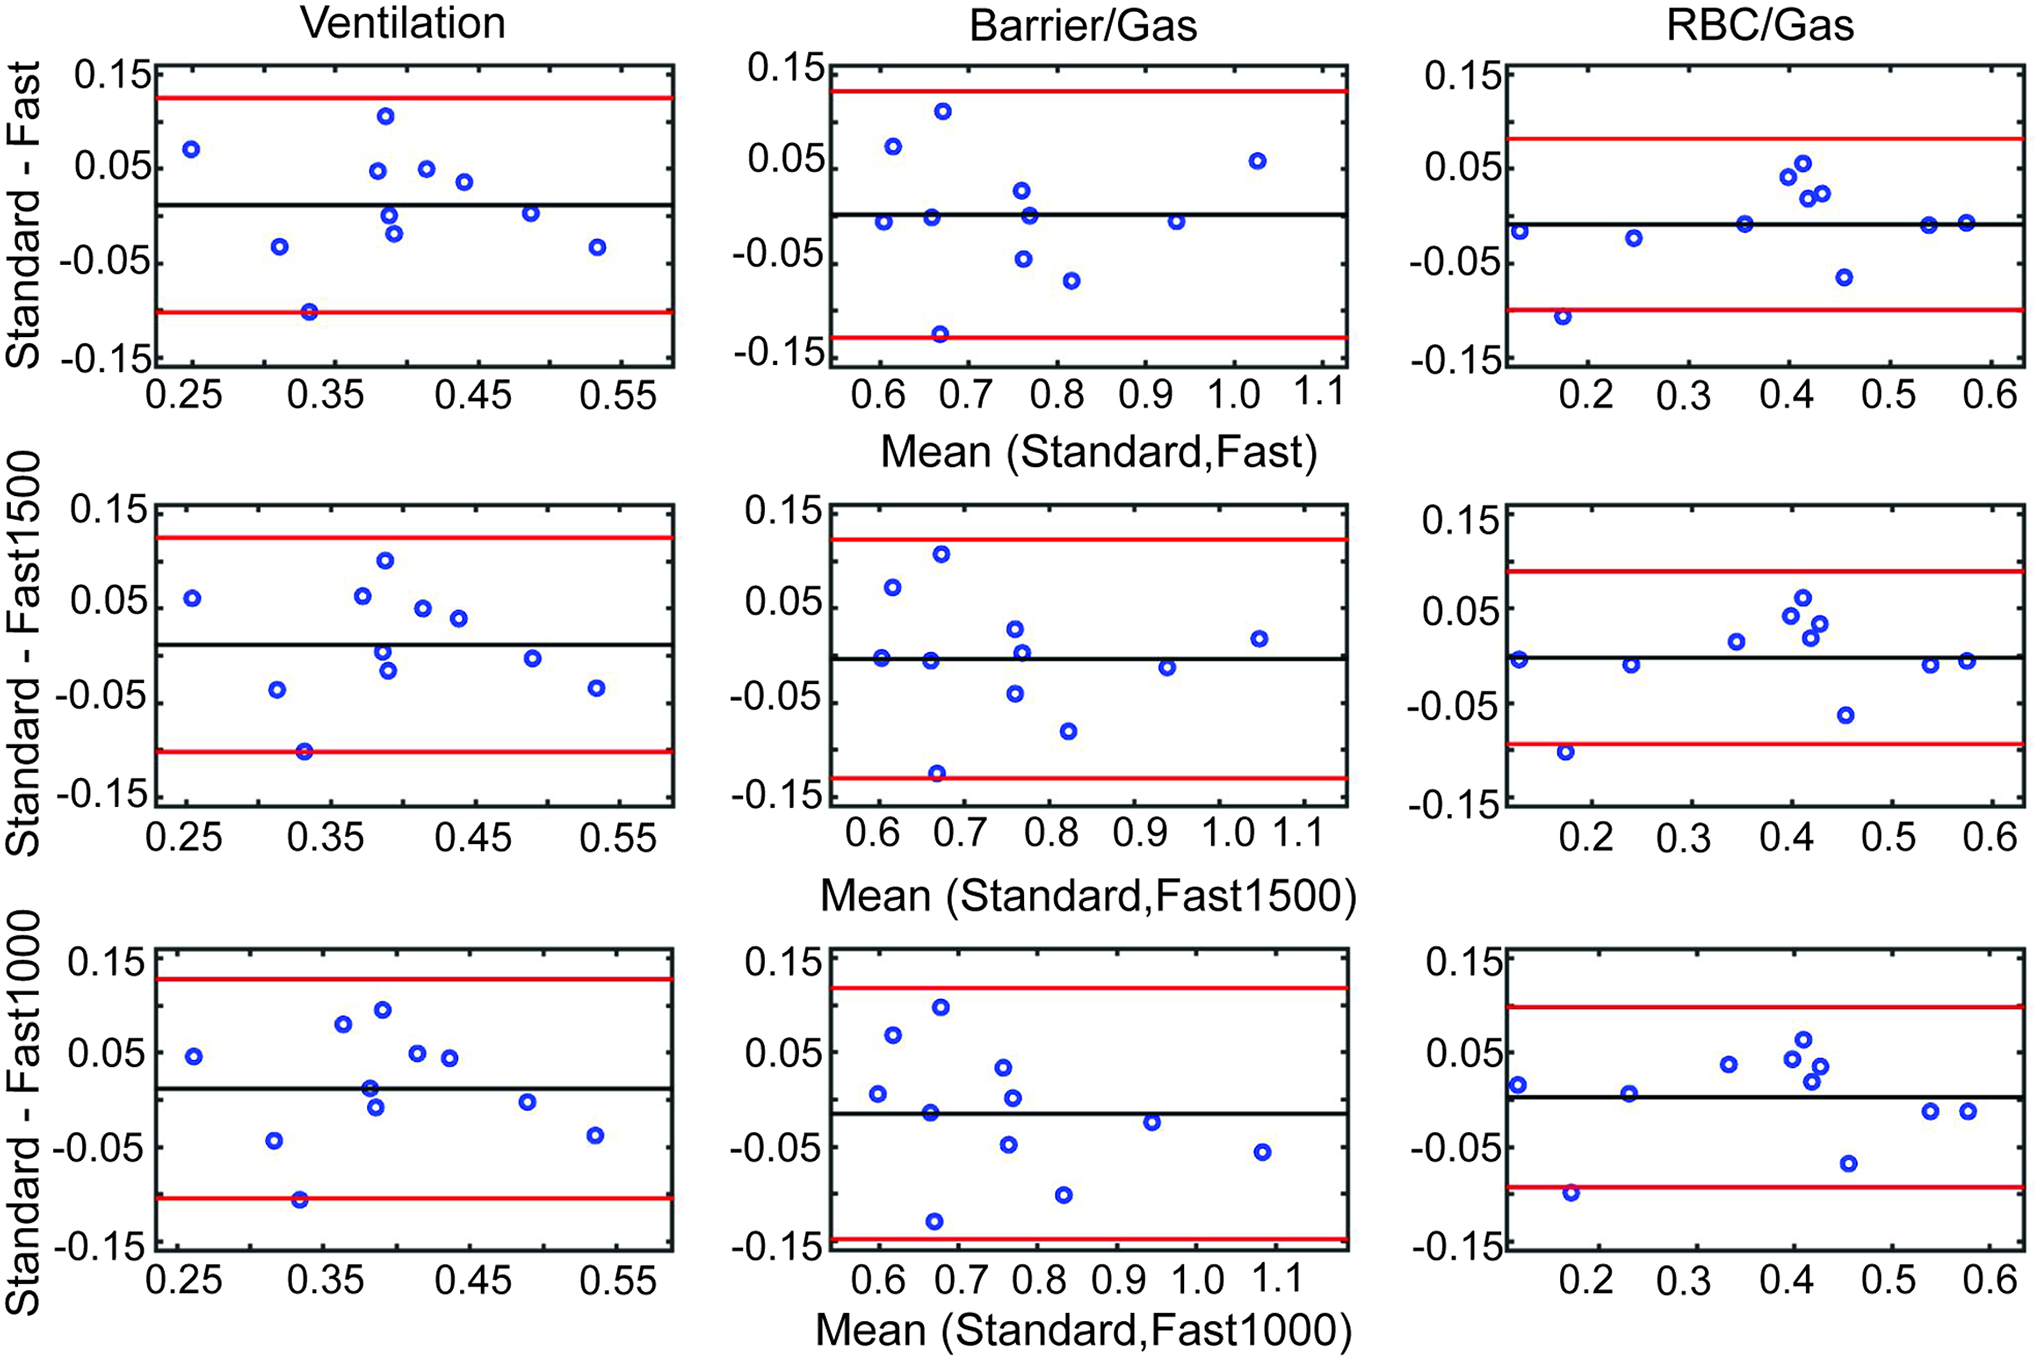
Figure 3.

Bland Altman analysis comparing the measurements of mean ventilation (column 1), Barrier/Gas (column 2), and RBC/Gas (column 3). Measurements from Fast (top row), Fast1500 (middle row), and Fast1000 reconstructions are compared to the Standard reconstruction. In every case, the mean difference between measurements is near to 0, which shows that the different imaging parameters and sampling percentages yield similar mean values.
