
Figure 1. Distribution of children’s blood lead concentrations by study visit at ages 1, 2, 3, 4, 5, and 8 years (The HOME Study; Cincinnati, OH).
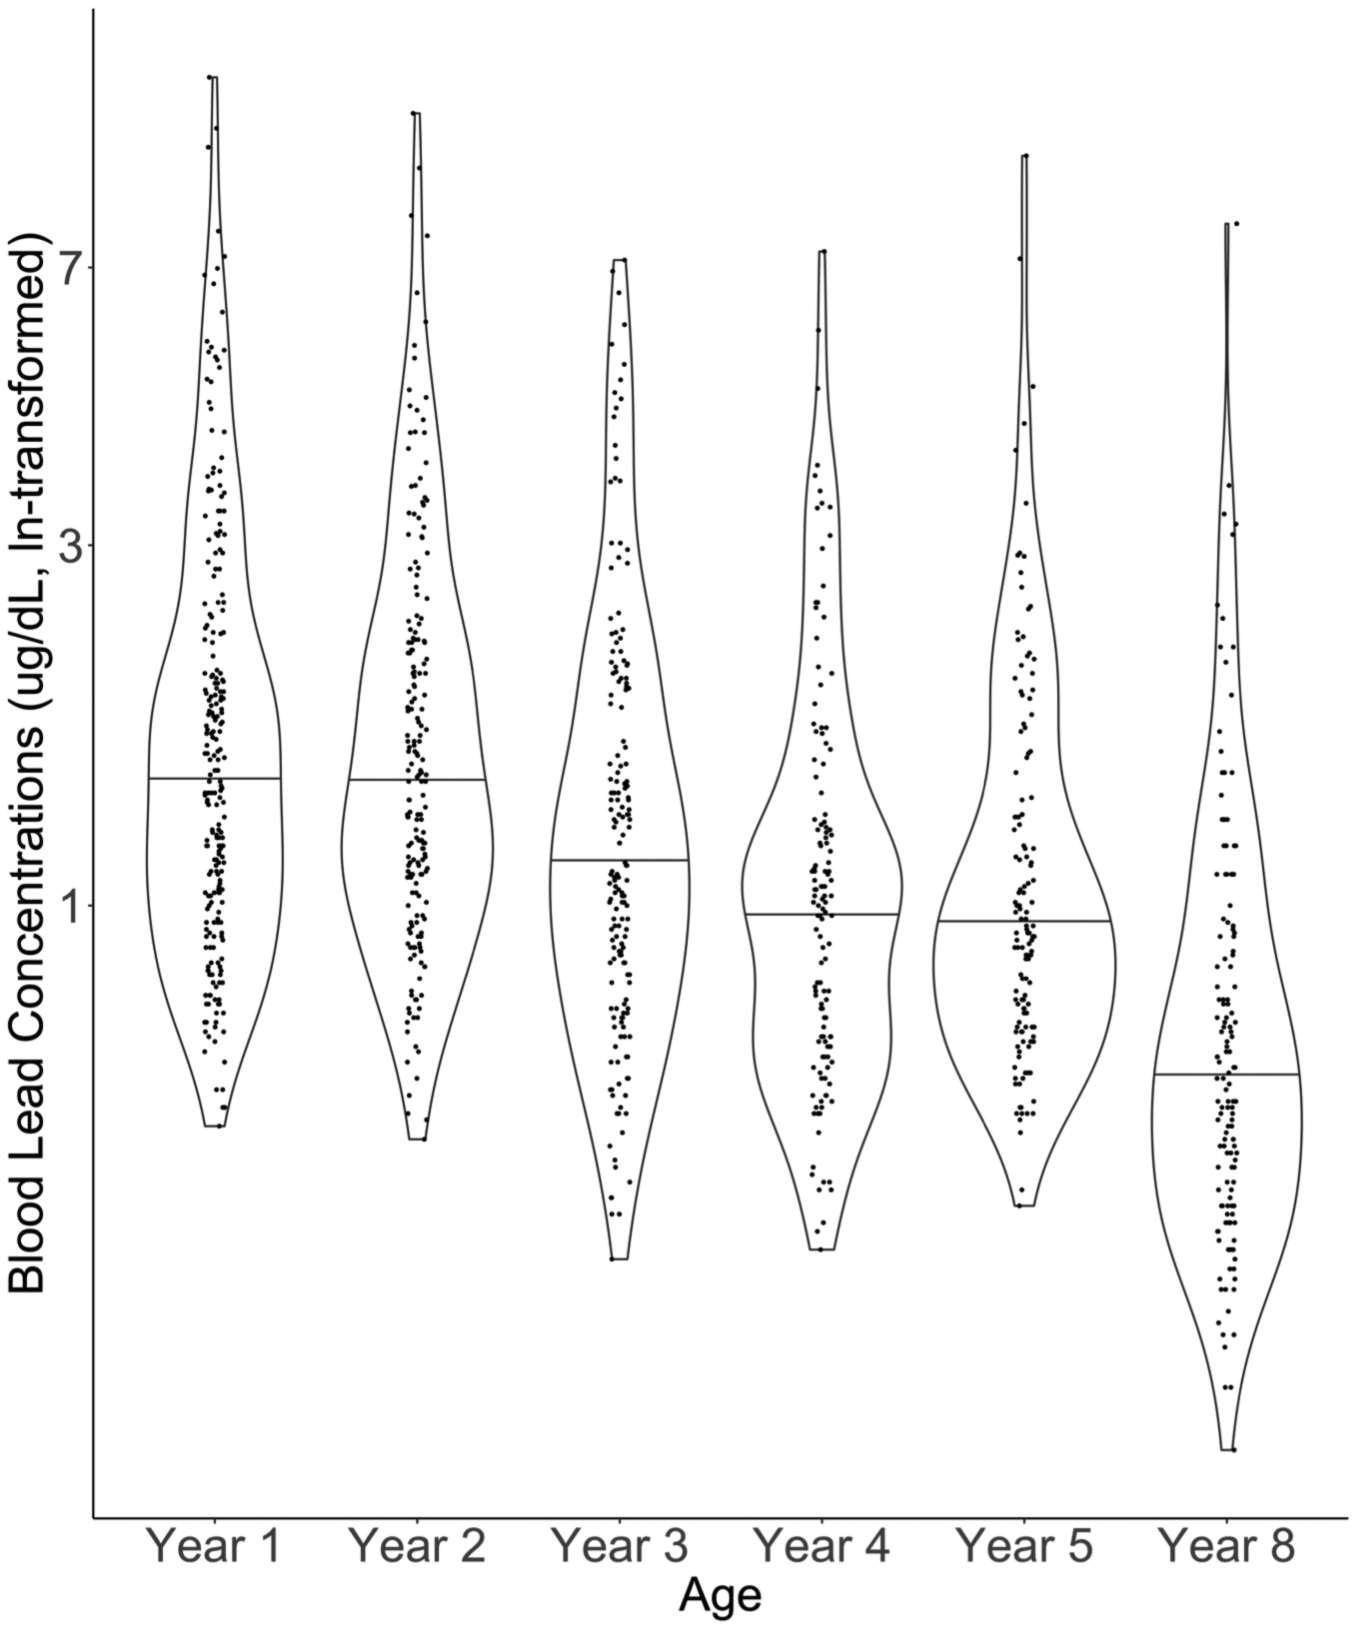
Solid line indicates median of each distribution. Jittered dots are individual observations. Smoothed lines are density functions. Labels on the y-axis have been back-transformed. Observations: Year 1= 229; Year 2 = 203; Year 3= 182; Year 4= 133; Year 5 = 140; Year 8= 147.