
Figure 2. Adjusted difference in repeated BASC-2 scores at ages 2–8 years per unit increase in ln-transformed blood lead concentration at ages 1, 2, 3, 4, 5, and 8 years.
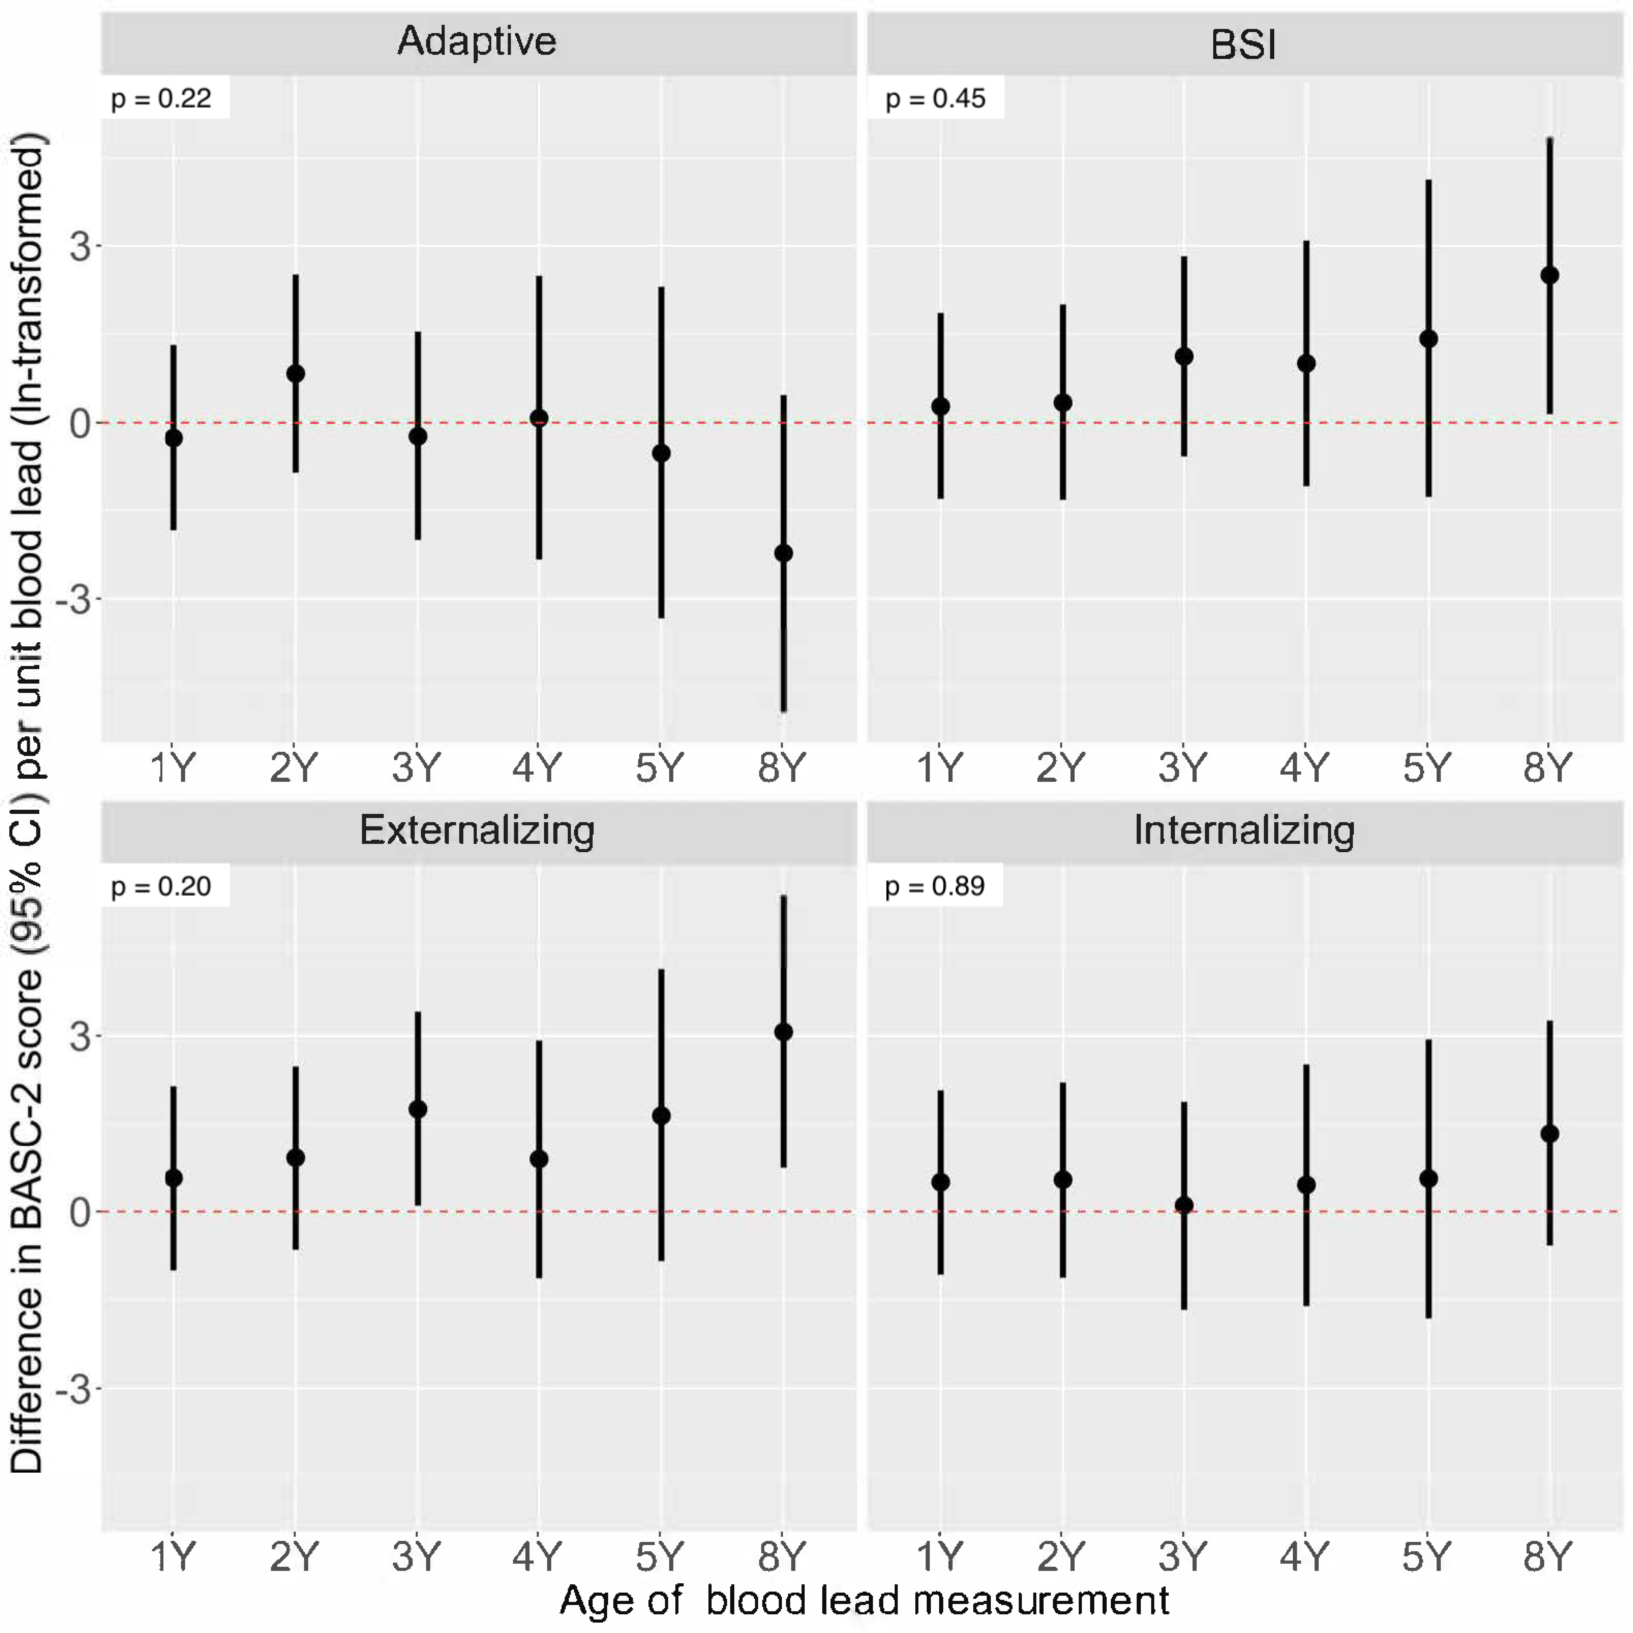
Model adjusted for child’s age, sex, intervention group, household income, maternal race, maternal depressive symptoms, child’s serum cotinine. Total participants = 244 (BASC observations: 2Y = 222; 3Y = 210; 4Y = 151; 5Y = 164; 8Y = 171). Heterogeneity p-values included to indicate difference in lead-BASC associations by child’s age at blood lead measurement.