
Fig. 3. Cholesterol accumulated in Lamp1 positive cytosolic vesicles in human Wnt5a−/− VSMCs.
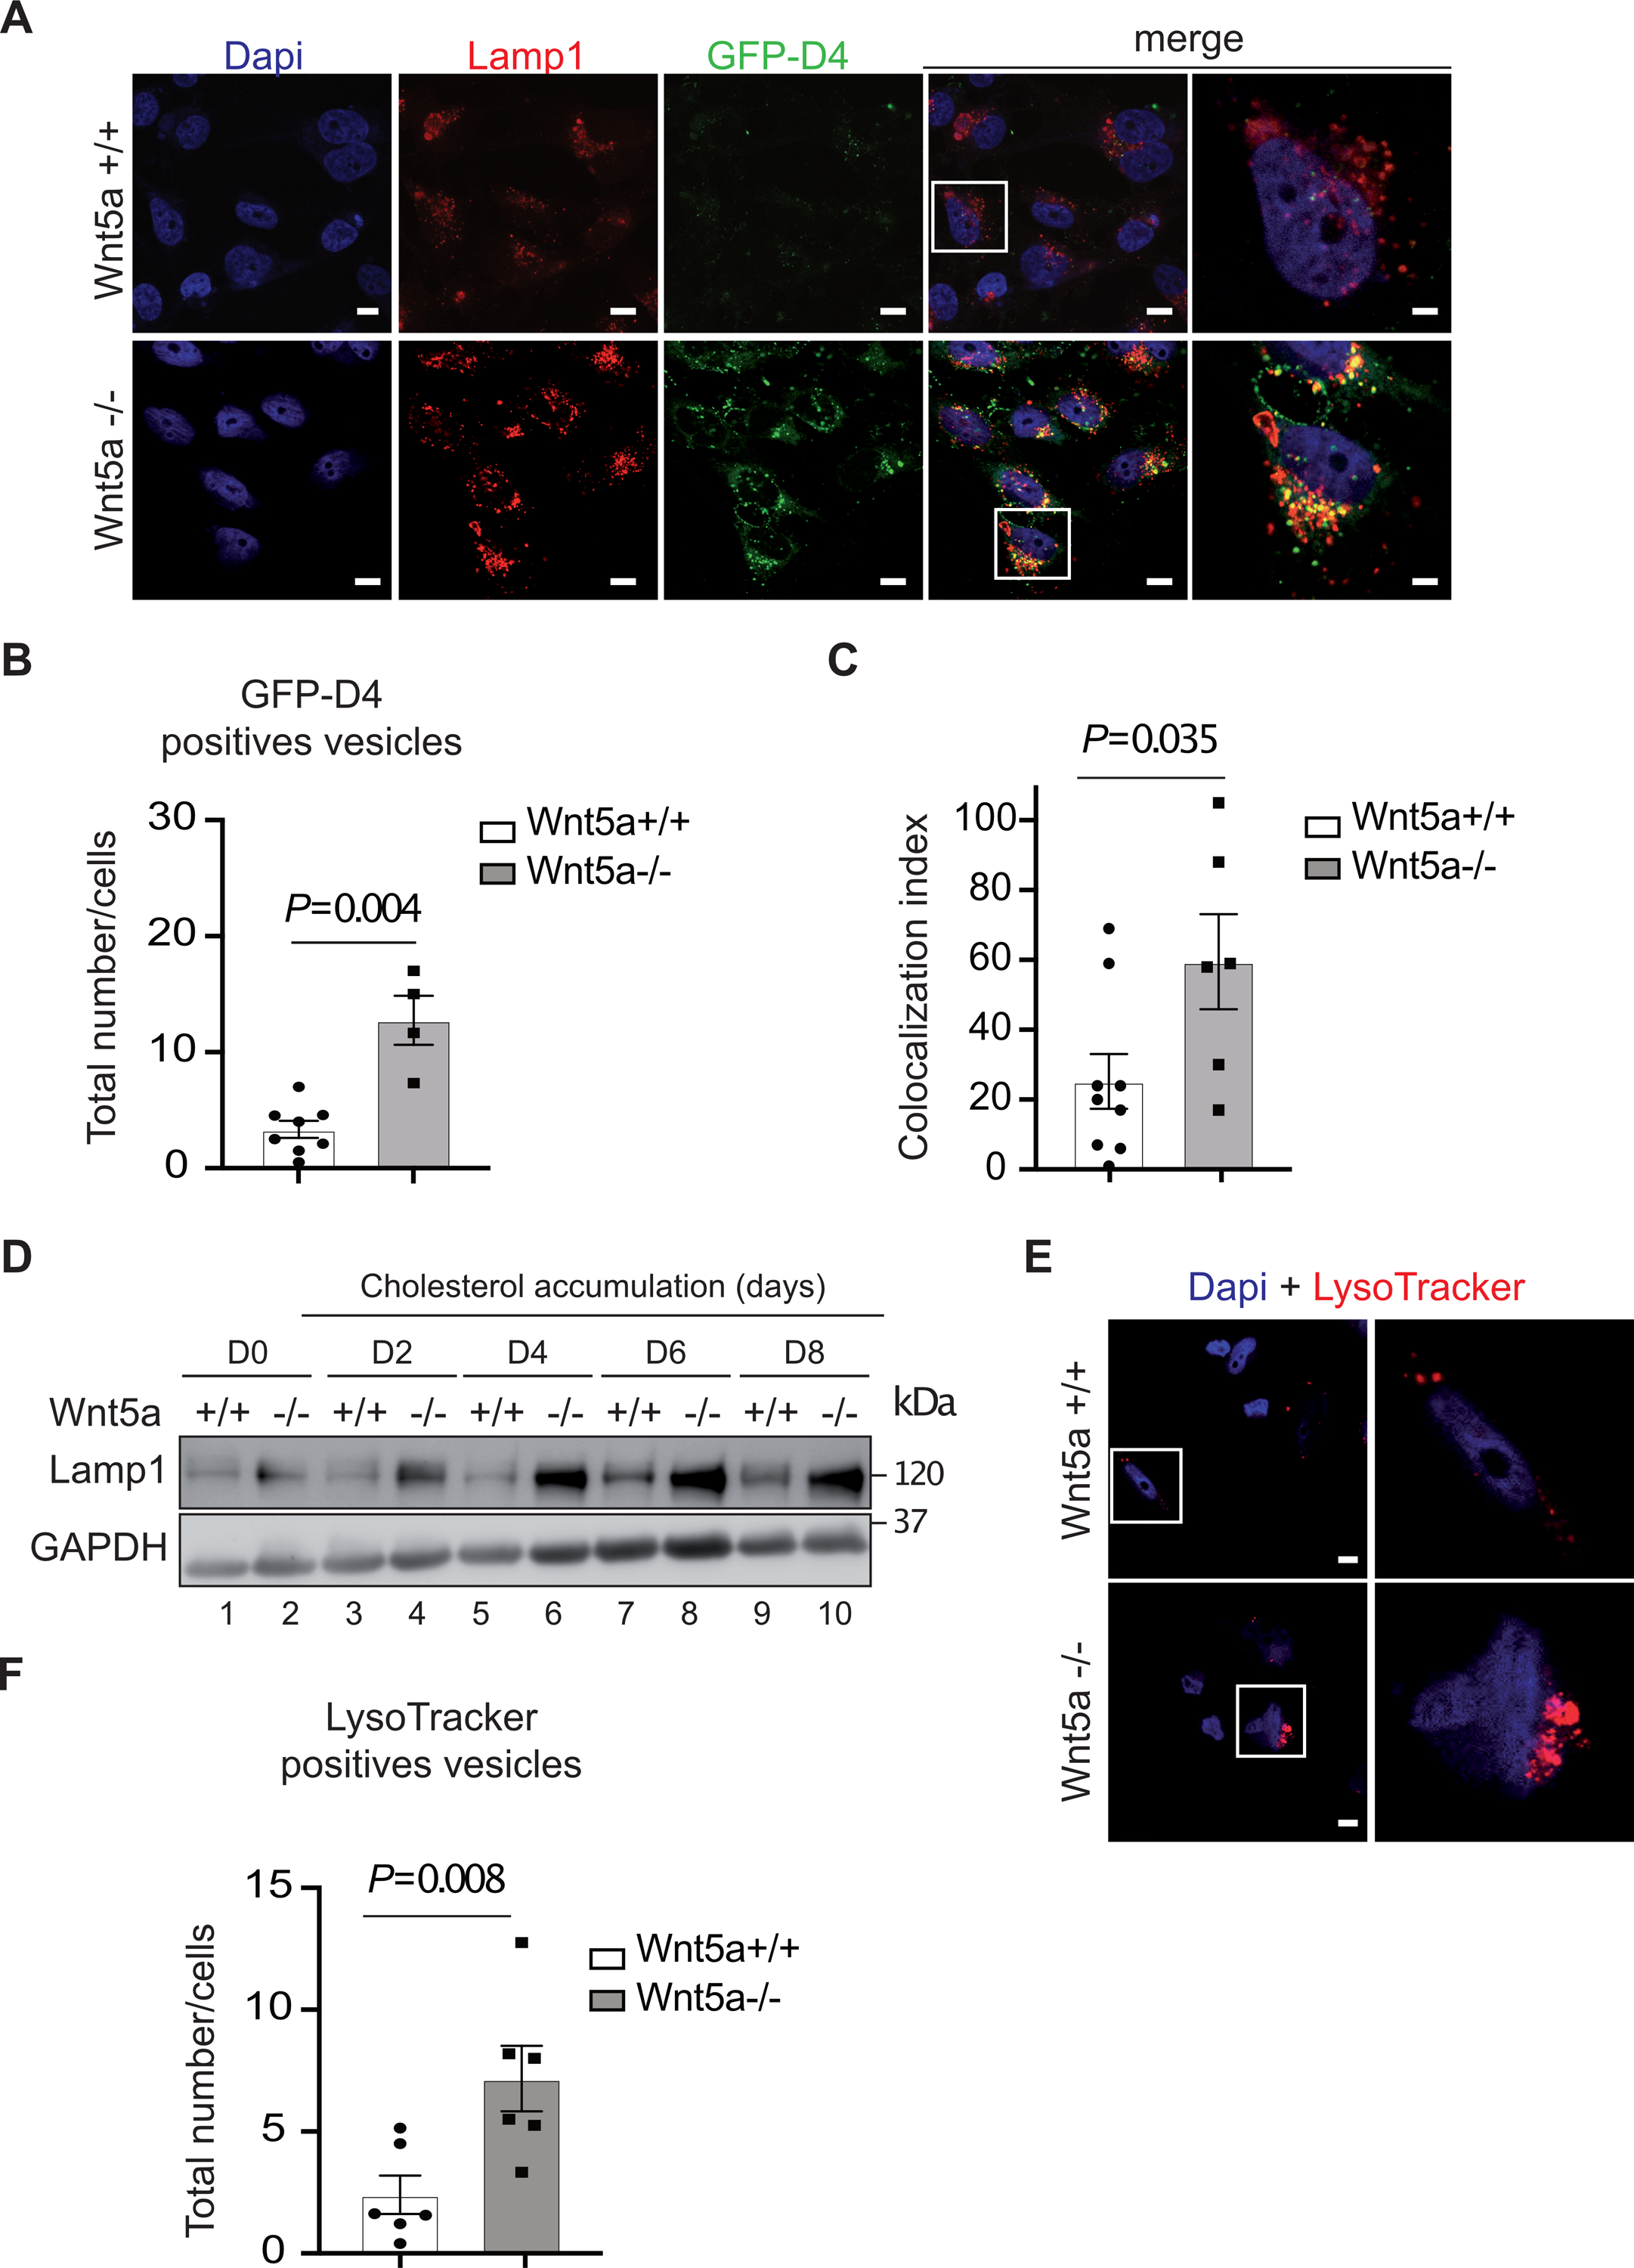
A, Cholesterol accumulation in human VSMCs Wnt5a−/− and controls labeled with anti-Lamp1 antibodies (red) a LELs marker, and with the fluorescent cholesterol probe GFP-D4 (green). Nuclei were stained in blue with Dapi. Higher magnification (2.5X) images of the areas outlined in white are shown in the right panels. Scale bar 5μm (n=4). B, Quantification of GFP-D4 positive vesicles/cells in human VSMCs Wnt5a−/− and controls (n=8 Wnt5a+/+, n=4 Wnt5a−/−). C, Quantification of confocal analysis shows increased colocalization between GFP-D4 (cholesterol) and Lamp1 (LELs) in human VSMCs Wnt5a−/− compared to controls (n=9 Wnt5a+/+, n=6 Wnt5a−/−). D, A representative immunoblot shows the protein expression of Lamp1 during the course of cholesterol accumulation (n=3). E, Human VSMCs Wnt5a−/− and controls were treated with 50 nM lysosome-tracker red. Higher magnification (2.5X) images of the area outlined in white are shown on the right. Scale bar 6μm (n=4). F, Quantification of lysosome-tracker red positive vesicles (n=6 Wnt5a+/+ and Wnt5a−/−). B, C, and F show individual value along with mean±SEM. For C, statistical significance was assessed by Shapiro-wilk to test normality followed by an unpaired t-test. For B and F statistical significance was assessed by Shapiro-wilk to test normality followed by a Mann-Whitney test. B, P=0.004; C, P=0.035 and F, P=0.008 indicate significance relative to Wnt5a+/+.