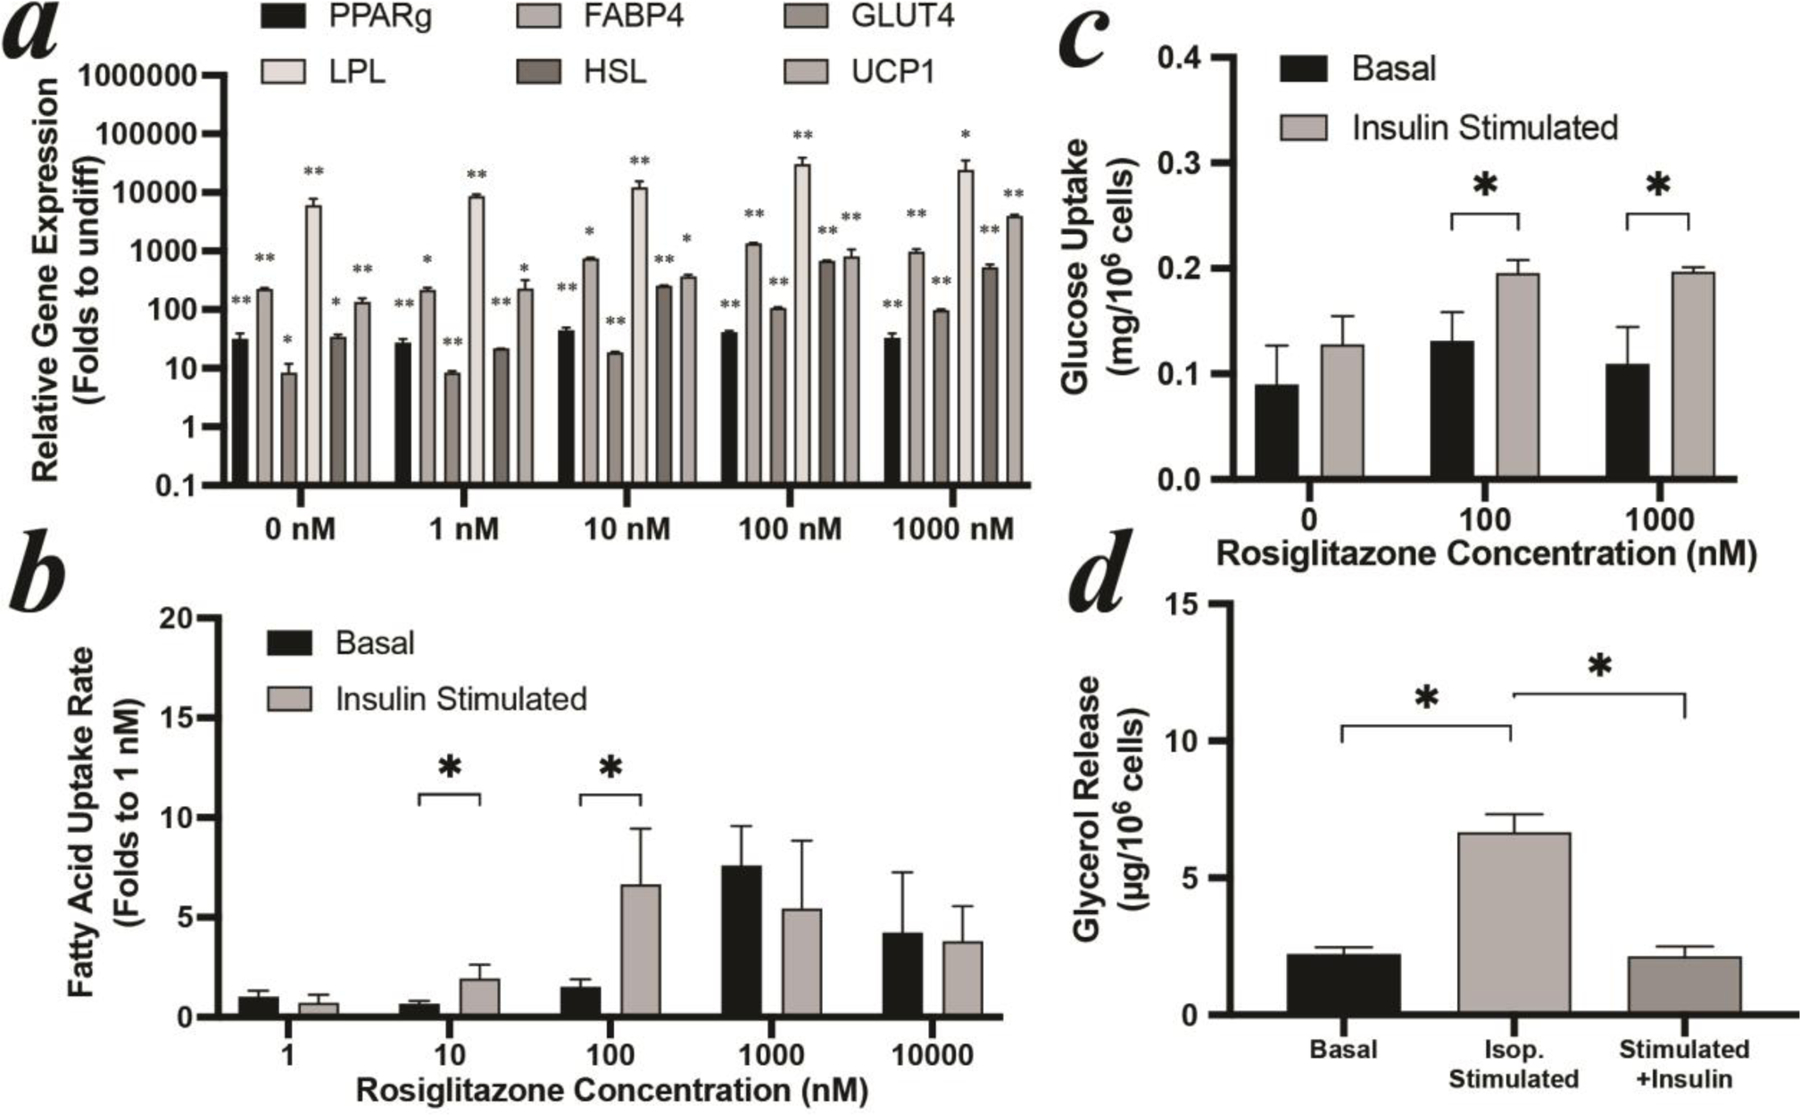
Figure 2: optimization of iPSC-MSCs differentiation.

(a) gene expression, (b) free fatty acid uptake, and (c) glucose uptake of iPSCs-derived adipocytes with different rosiglitazone concentrations. (d) lipolysis of iPSCs-derived adipocytes with 100 nM rosiglitazone. All iPSCs-derived adipocytes were differentiated for 14 days. Expression values in (a) are shown relative to the mean of undifferentiated iPSC-MSCs set as 1. Stars label significant difference compared to undifferentiated iPSC-MSCs.
