
Figure 3: Comparison to commercial human adipocytes.
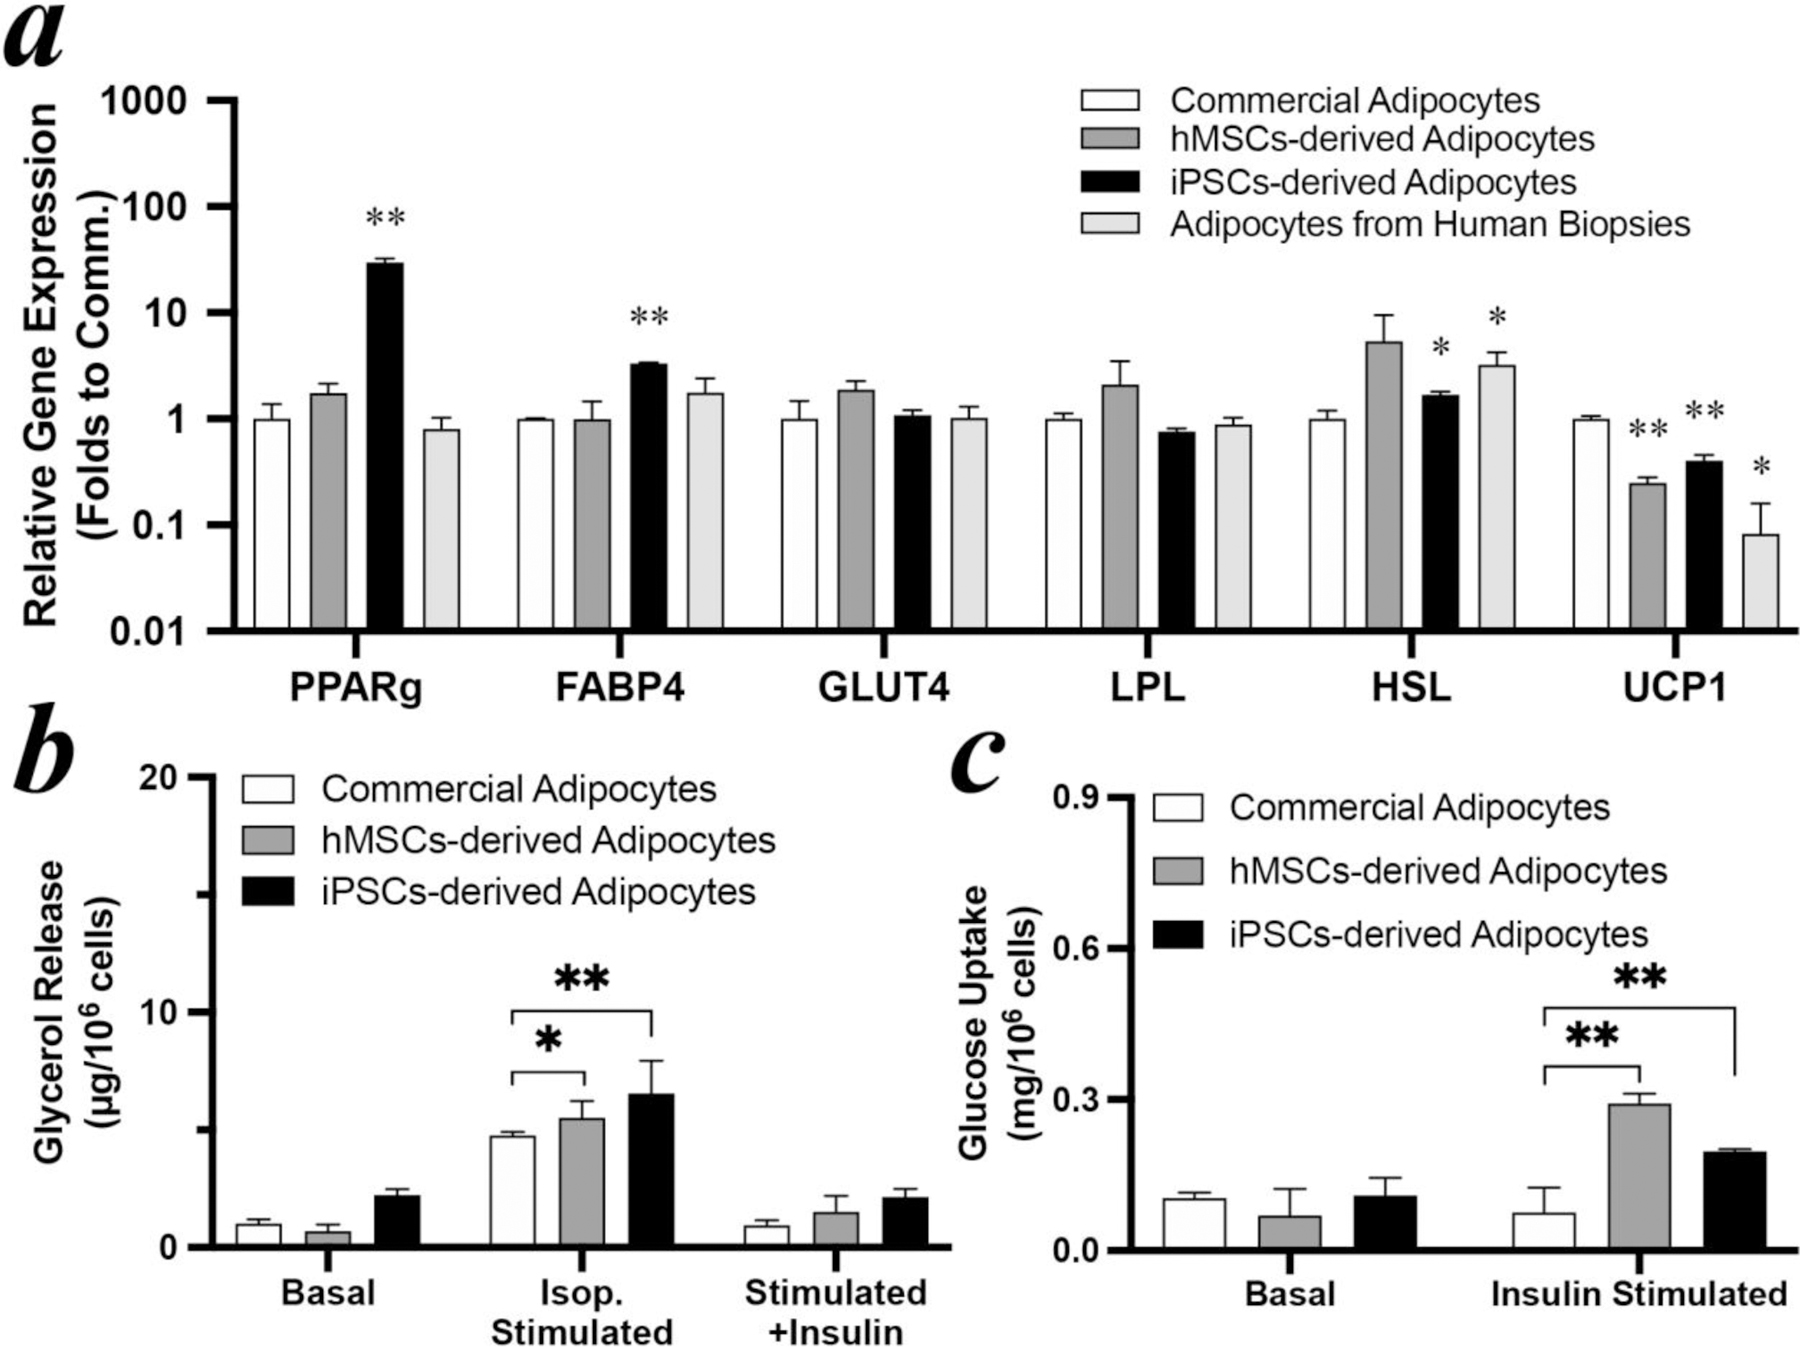
(a) gene expression, (b) lipolysis, and (c) glucose uptake of hMSCs- and iPSCs-derived adipocytes after 14 days differentiation with 100 nM rosiglitazone and commercial adipocytes. Expression values in (a) are shown relative to the mean of commercial adipocytes set as 1. Stars label significant difference compared to commercial mature adipocytes.