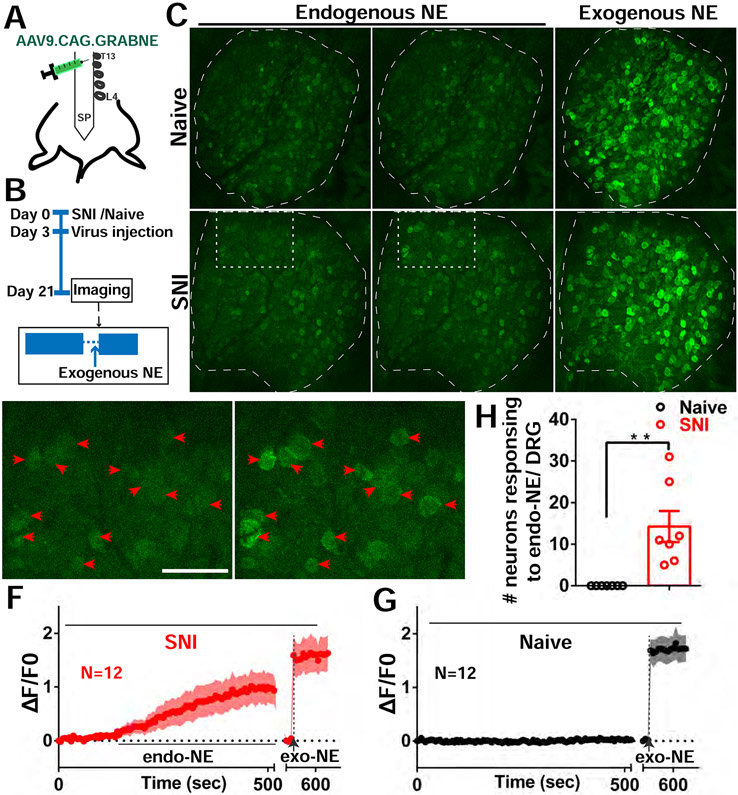
Figure 6. Endogenous NE release in DRGs after SNI.
(A) Diagram showing the i.t. injection with AAV9.CAG.GRABNE in WT mice.
(B) Diagram showing the experimental procedure.
(C) Representative images of NE sensor signals of naive and SNI mice. Naive mice had no endogenous NE released. Mice with SNI show endogenous NE released sporadically (white rectangle). At the end of the recording session exogenous NE is dropped onto DRG (both naive and SNI mice showed NE sensor activation).
(D-E) Enlarged image of rectangle area from SNI image in (C). Red arrowheads indicate 12 neurons with spontaneous NE signals (cluster activation) from quiescent (D) and release periods (E).
(F-G) Averaged NE signal traces with ±95% confidence intervals for the 12 neurons indicated by arrowheads in SNI mouse (F) and 12 randomly selected neurons from naive mouse (G).
(H) Summary of NE sensor imaging from SNI and Naive mice. DRG of SNI mice exhibit a significantly higher number of neurons responding to endogenous NE release.
Scale bar, 100 μm. Each open circle represents an individual mouse. Data are represented as mean ± SEM. **p < 0.01; (H) by two-tailed unpaired t test.

