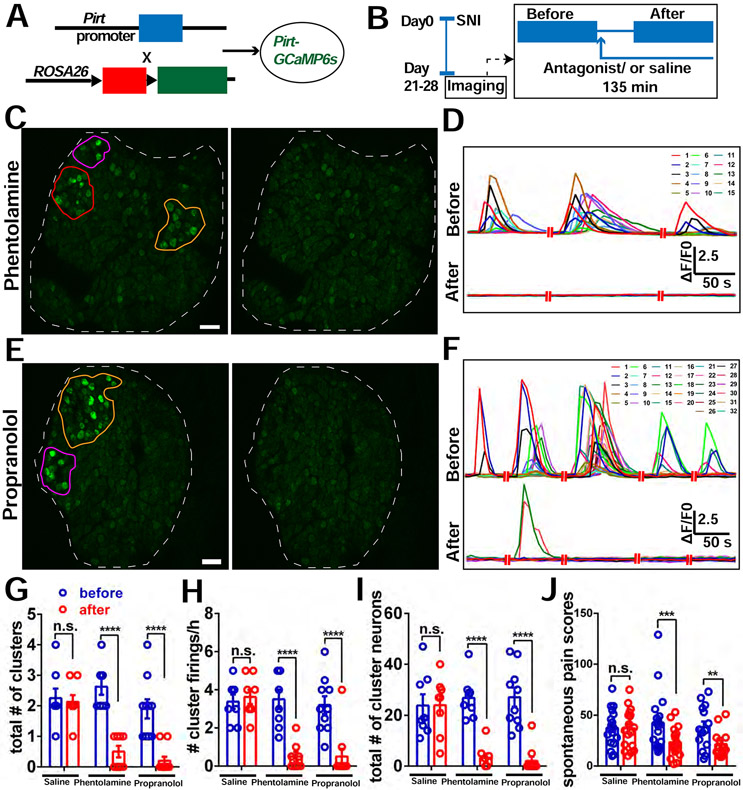
Figure 7. Block of adrenergic receptors in DRG reduces incidence of CFEs and relieves spontaneous pain.
(A) Diagram showing the mating strategy.
(B) Diagram showing the experimental procedure. We imaged the Pirt-GCaMP6 mice with SNI at POD 21-28 for 2 hours. If CFEs were observed, a sympathetic blocker, either phentolamine (5 μM), or propranolol (1 μM) or vehicle (saline) solution was then applied topically onto the DRG and allowed to incubate for 15 minutes, followed by an additional 2 hours of recording with about 5 to 10 μL solution covering the DRG.
(C) An example of cluster firing that decreased after using phentolamine (antagonist of α-receptor). There are 3 clusters (orange, purple and red circles) before addition of phentolamine. All clusters are inhibited after.
(D) Representative traces of neurons in the orange cluster which are numbered in (C) before and after addition of phentolamine.
(E) An example of cluster firing that decreased after using propranolol (antagonist of β-receptor). There are 2 clusters (orange and purple circles) before addition of propranolol. Both clusters are inhibited after.
(F) Representative traces of neurons in the orange cluster which are numbered in (E) before and after addition of propranolol.
(G-I) The total number of clusters (G), frequency of cluster firing (H), and total number of cluster firing neurons (I) significantly decreased after addition of antagonists of adrenergic receptors on DRG, but not with addition of saline. The data of the saline group are the same as in Fig. 2.
(J) Spontaneous pain scores significantly decreased after i.t. administration of either 5μL, 10μM phentolamine or 5μL, 10μM propranolol, or 5μL vehicle alone to SNI mice, but not after administration of vehicle.
Scale bar, 100 μm. Each pair of open circles (before and after) represents an individual mouse. Data are represented as mean ± SEM. **p < 0.01; ***p < 0.001; ****p < 0.0001; n.s., not significant; (G) to (J) by two-way repeated measures ANOVA with Sidak’s posttest.

