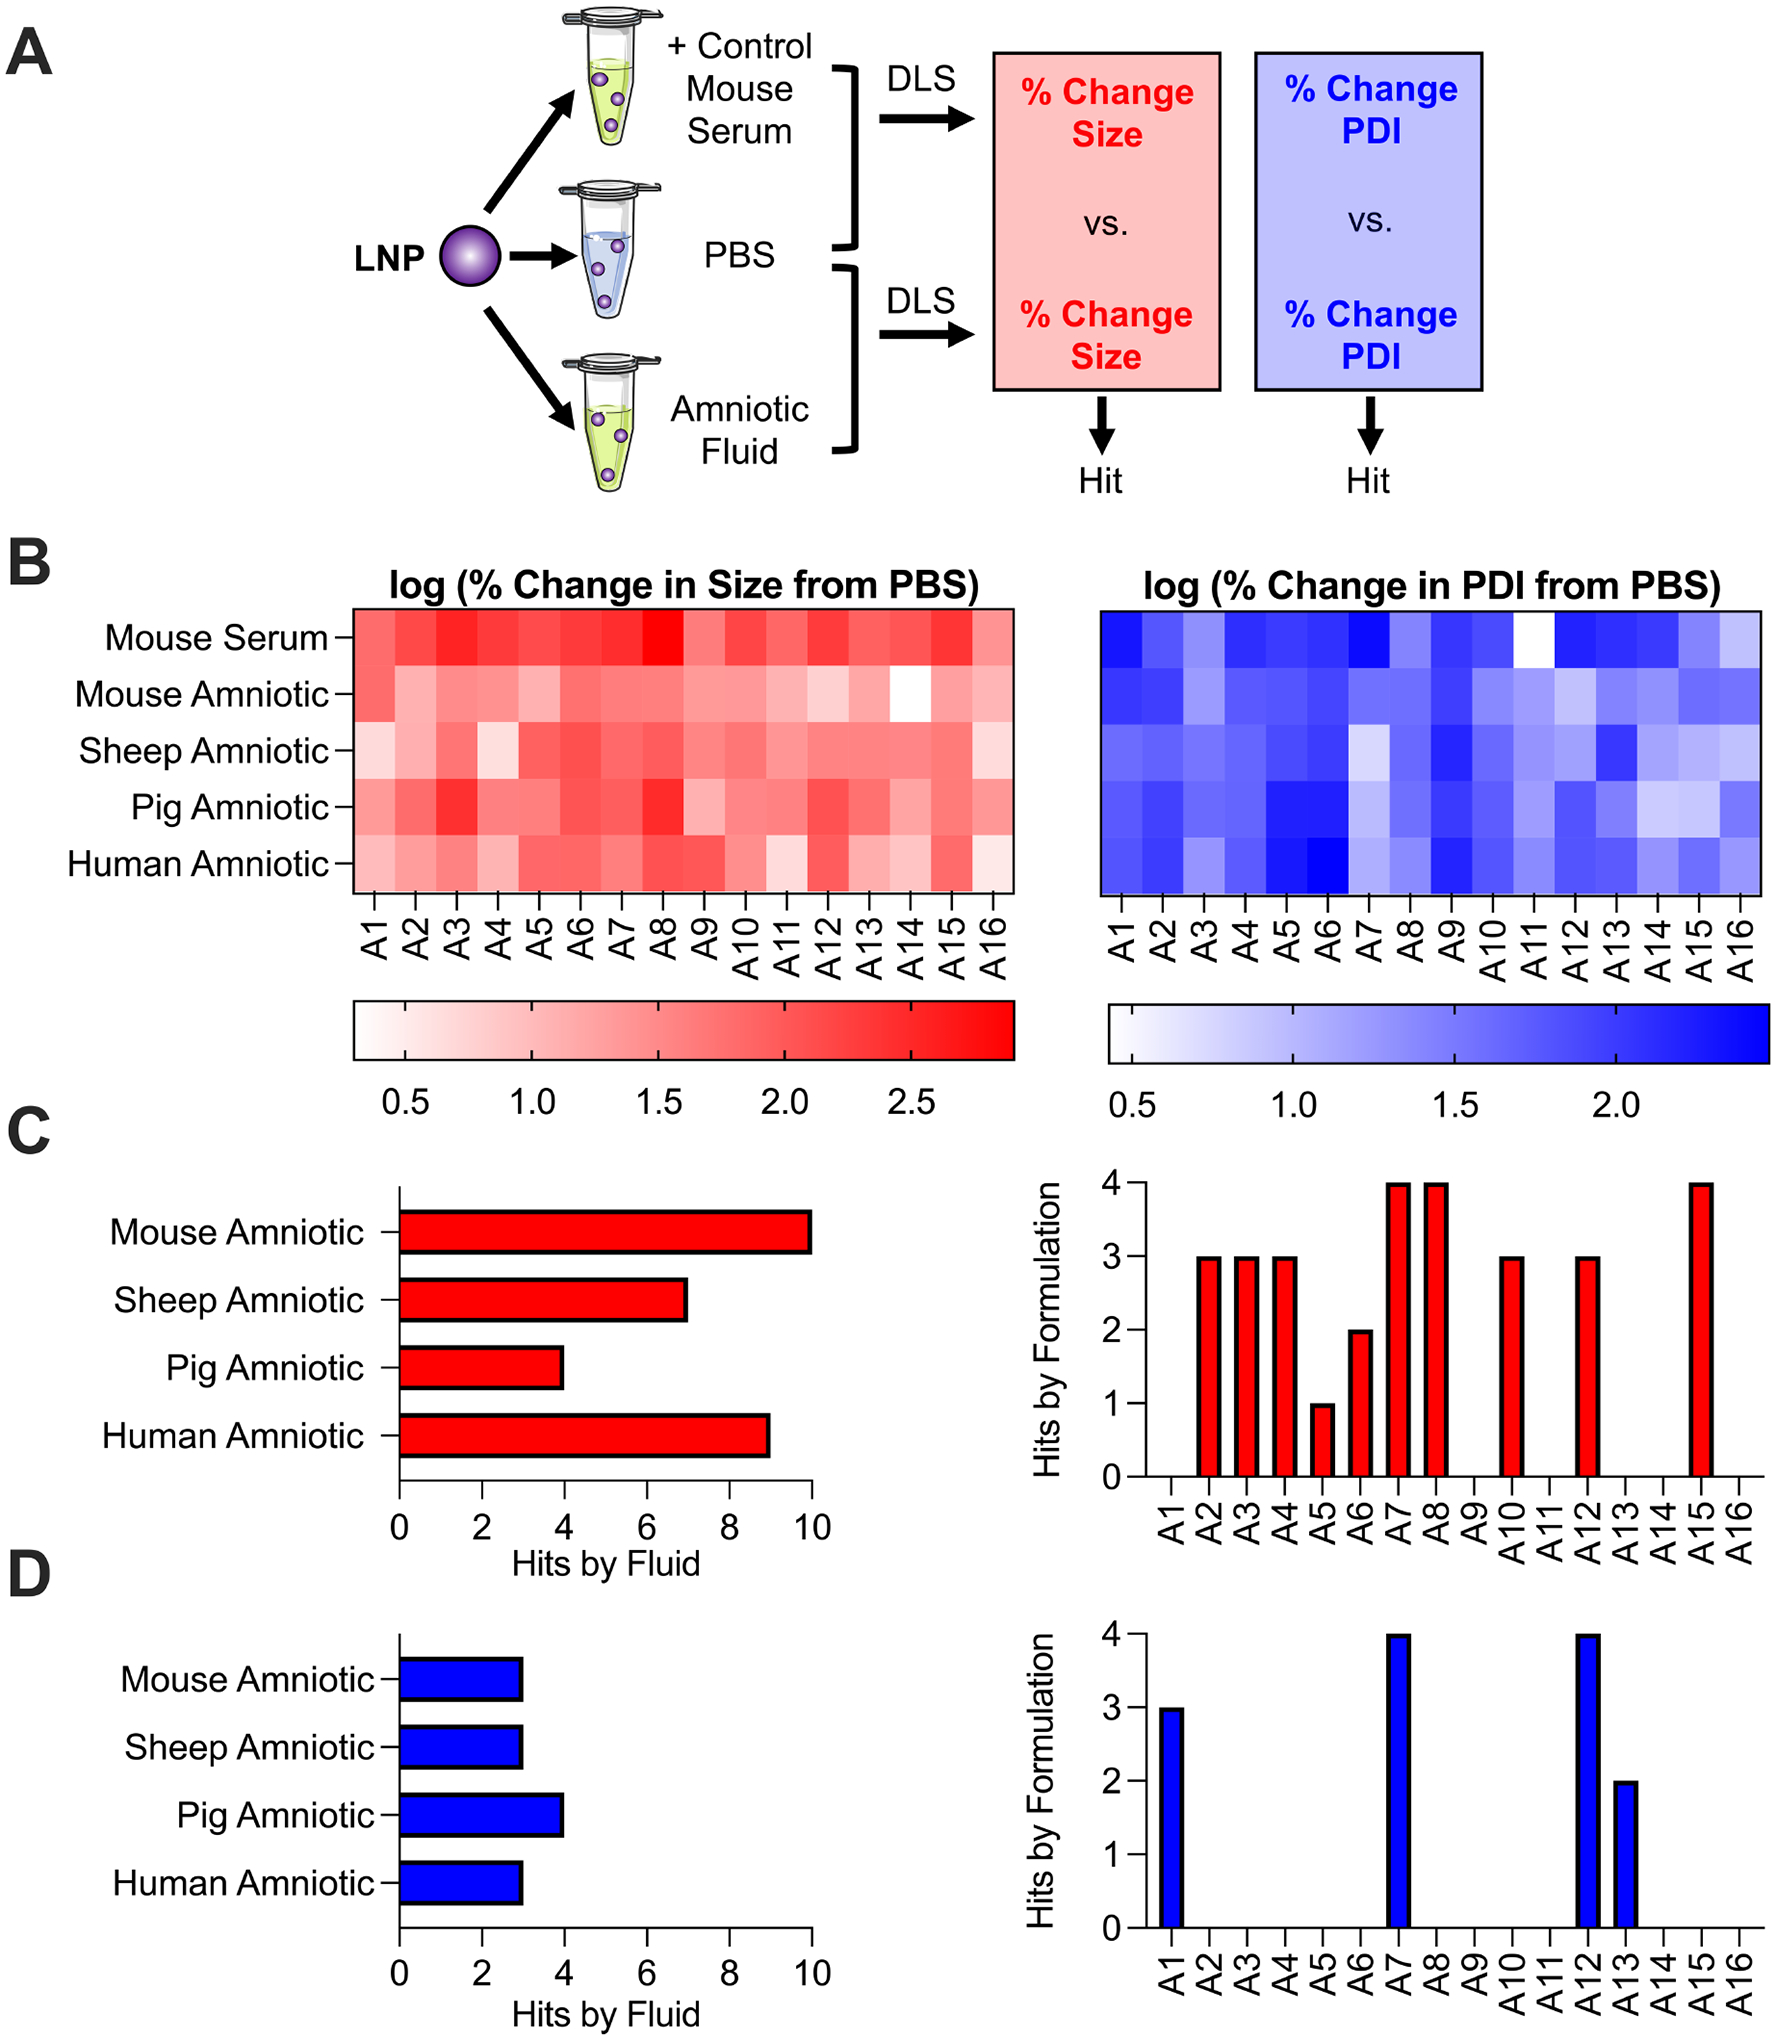
Figure 3 – LNP library stability in mouse serum and amniotic fluids.

(A) Schematic depicting LNP library screen using DLS where percent change in LNP size or PDI in each amniotic fluid is calculated from the LNP size or PDI in PBS alone. These percent change measurements are compared to those in mouse serum as a positive control to identify hits. (B) Heatmaps depicting log transforms of LNP percent change in size and percent change in PDI (from PBS) in each fluid. Red – darker colors represent larger percent changes in size from the LNP in PBS alone. Blue – darker colors represent larger percent changes in PDI from the LNP in PBS alone. (C and D) 2-way ANOVA results indicating hits across amniotic fluids and formulations for percent change in size (C) and percent change in PDI (D) measurements. A hit is defined as an LNP in a given amniotic fluid with a significantly smaller (p < 0.05) percent change in size or PDI measurement than the LNP in mouse serum as determined from 2-way ANOVA.
