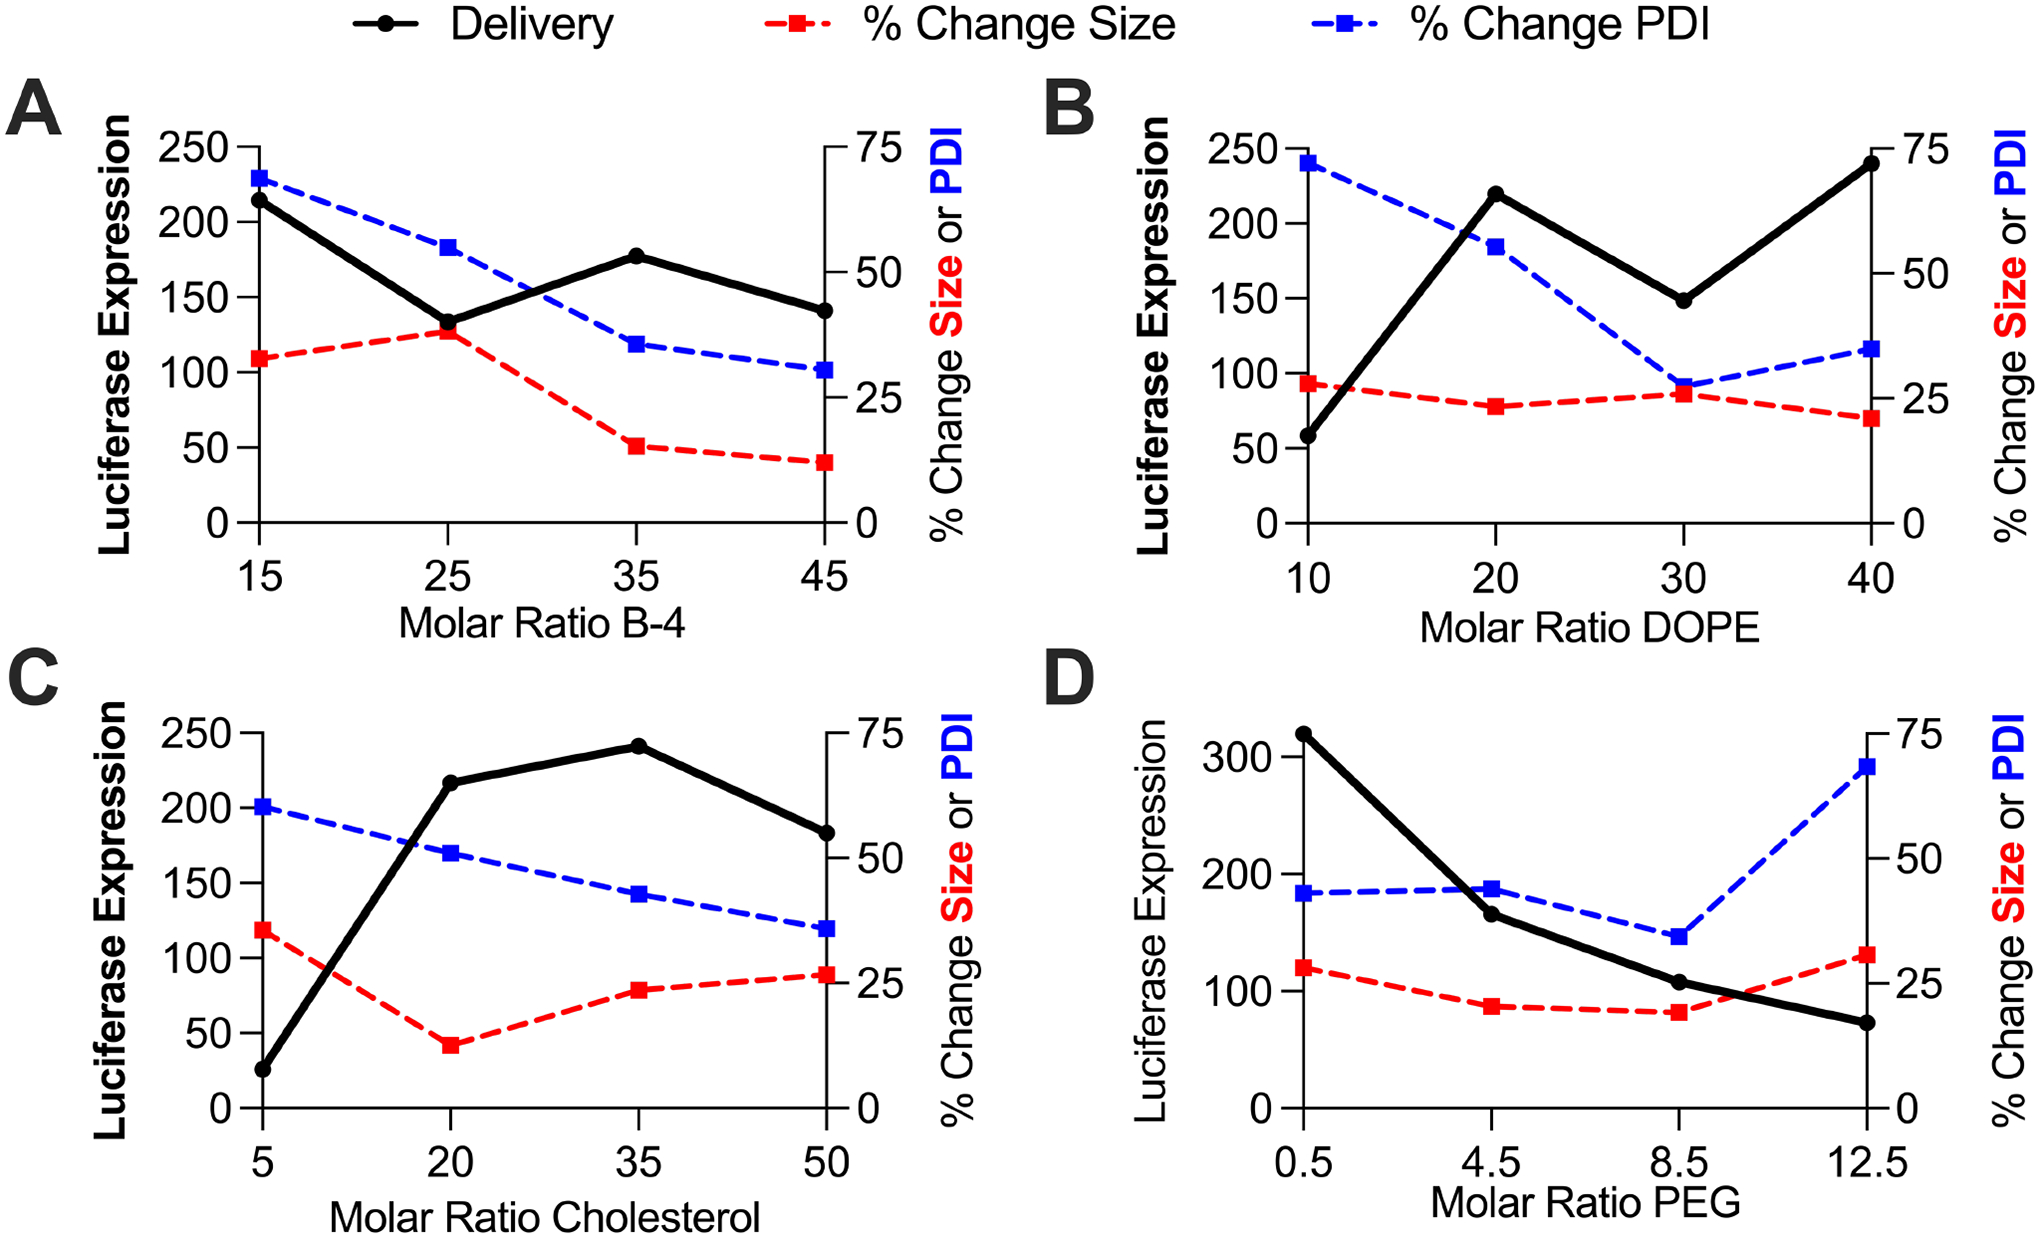
Figure 7 – LNP structure function relationships with ex utero stability and in vitro delivery.

Each data point represents an average of the stability and luciferase expression measurements of the four LNPs with the given excipient molar ratio. (A) Percent change in size and PDI decrease as ionizable lipid B-4 increases. (B) & (C) Percent change in PDI decreases and luciferase expression increases as the molar ratio of DOPE and cholesterol increases. (D) Percent change in PDI increases and luciferase expression decreases as the molar ratio of PEG increases.
