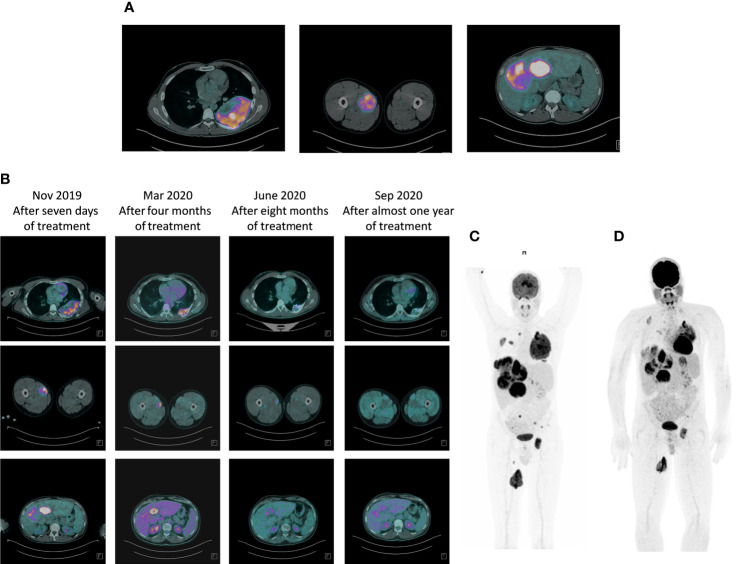
Figure 1.
Response to therapy with larotrectinib: 18FDG-PET/CT scan evaluation. (A) Baseline FDG PET/CT study showing coronal fused PET/CT image with abnormal FDG uptake in multiple liver metastases, left rib and left femor. (B) Progressive metabolic response to larotrectinib after 7 days, four months, eight months and after almost one year of treatment. (C) Maximum intensity projection (MIP) PET/CT images: pre-therapy PET/CT scan again showed FDG-avid metastases occupying virtually the entire liver, left rib and left femor, all demonstrating high FDG avidity. (D) Seven days after the start of larotrectinib, PET/CT scan showed early tumor shrinkage with a reduction in FDG avidity in all previously described lesions.

